
If you rely on technical analysis, you’ve likely come across powerful indicators and tools during your trade, such as candlestick patterns, which visually represent price action and help traders spot potential reversals or continuations of the security, making it easy to trade. One such candlestick pattern is the Bearish Marubozu.
In this article, we will understand what the Bearish Marubozu is, its structure, and how to trade it with an example, when to use it, and its pros and cons.
What is Bearish Marubozu?
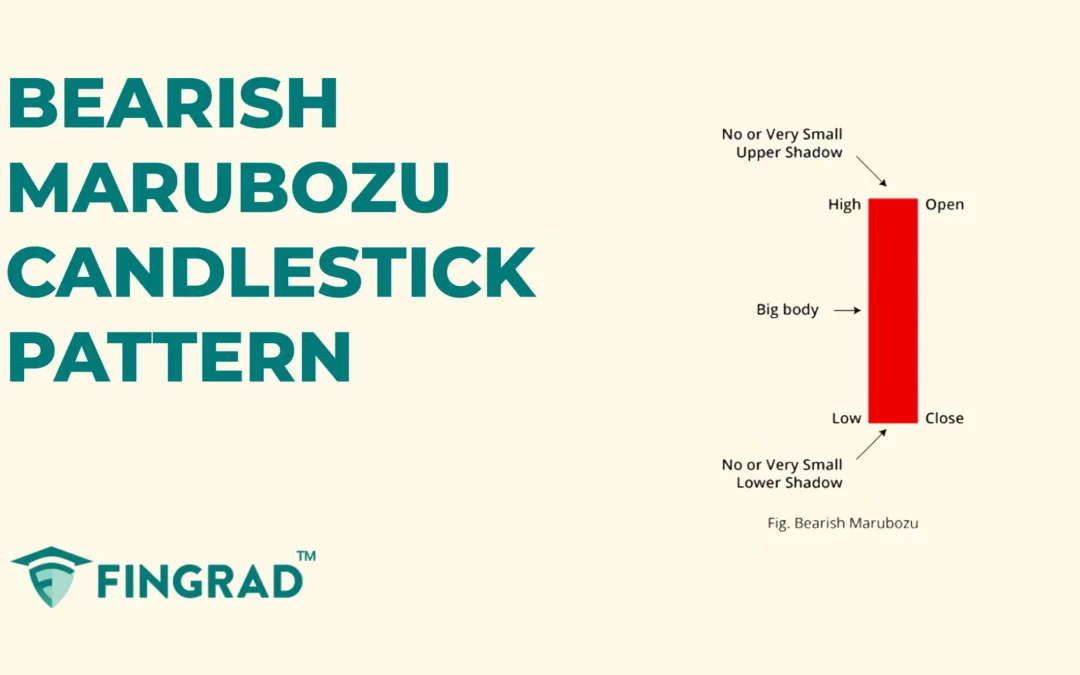
The Bearish Marubozu is a single candlestick pattern that features a long body, indicating a potential reversal and signaling a downtrend characterized by strong selling pressure.
The candlestick does not have any upper or lower wicks. In some cases, a very small wick on either side can also be considered for the validation of the bearish marubozu pattern.
- When the candlestick appears at the top of an uptrend, it signals a potential reversal to a downtrend.
- When spotted within an existing downtrend, it can suggest the further continuation of that trend.
The candlestick structure indicates sellers taking over the trend.
Structure:

- In a bearish marubozu candlestick pattern, the open price is equal to the high price of the candlestick.
- And the close price of the candlestick will be equal to the low price of the candlestick.
As it indicates that sellers are in full control of the trend.
The Bearish Marubozu candlestick pattern psychology:
- Initially, in the current trend, the buyers are in full control of the trend, driving the price to its high, indicating further upward movement.
- Sellers Push Down and Trend Reversals: At the top of an uptrend, sellers step in with strong conviction, leading to the formation of a solid red candlestick.
As the price opens, sellers immediately take control, pushing the price lower throughout the session without giving buyers a chance to pull it back. This results in a bearish candlestick with no wicks on either end, reflecting complete dominance by the seller. The aggressive selling pressure signals a momentum shift and indicates the potential start of a strong downtrend.
How to trade the Bearish Marubozu?
After identifying the bearish marubozu candlestick, wait for the next candlestick to close bearish to confirm the trend.
Entry:
- An entry to the short position in the security can be placed at the close of the pattern formation.
Stop-loss:
- The stoploss for the short position can be placed at the high of the bearish marubozu pattern formed.
Target:
- The target for the trade can be the nearest support level formed from the level of pattern formation.
- One can place the target based on your risk-reward ratio, also.
Example scenario for the past trade:
In the image below, you can look at the chart of “INFOSYS Ltd” stock at a 15-minute timeframe on 14th January 2025. You can see the sell signal generated using the Bearish Marubozu candlestick pattern, as it is a trend reversal candlestick.

When to Use the Bearish Marubozu?
- The Bearish Marubozu indicates a strong selling pressure and reversal of the uptrend. It helps the traders to understand the upcoming direction of the security.
- High trading volume with the Marubozu significantly increases its reliability.
- The high-volume Bearish Marubozu indicates a strong selling pressure, creating strong resistance as sellers push prices down.
What are the pros and cons of a Bearish Marubozu?
| Pros | Cons |
| 1. Forms a strong bearish candlestick, indicating the strength of the direction ahead. | 1. A low volume market condition can make a Bearish Marubozu pattern unreliable for reversals, raising misidentification risks. |
| 2. The candlestick is easy to spot for all, from beginners to experienced traders | 2. Can lead to quick counter-trend bounces if the market is already oversold. |
| 3. Provides good risk management as the reward is 1:2 and higher over a short period. | 3. Quick price movements after formation can make it hard to enter for sustained long-term trades |
| 4. When combined with additional indicators or tools, the efficiency and accuracy are high. | 4. During the events occurring, the efficiency of the strategy is very low due to unreliable volume in the market. |
In Closing
In this article, we covered what the Bearish Marubozu is, its structure, and how to trade it. Along with where to spot it, when to use it, and its limitations.
Bearish Marubozu adapts quickly to the market to identify the potential reversals of the price action, especially during the volatile market, making it more efficient. With proper risk management, discipline can pave the path to profitability. Bearish Marubozu indicates that clear entry and exit signals make it an accessible tool for beginners.
In any financial market worldwide, no indicator or tool is 100% accurate. When combined with additional indicators or tools, the efficiency and accuracy increase rapidly.
