
Across financial markets worldwide, charts communicate the price action, trend, and volatility of markets. Technical analysis, when applied, enhances the understanding of the market and makes better entry and exit decisions.
In this article, we will discuss the Bearish Harami Candlesticks pattern, its structure, the psychology of the pattern, how to trade it with an example, its application, its advantages, and its disadvantages.
What is the Bearish Harami candlestick?
The Bearish Harami candlestick pattern is a two-candlestick formation. It is a technical indication of potential reversal from a bullish direction to a bearish direction.
The word “Bearish” describes the upcoming trend, and “Harami” is derived from the Japanese word meaning “pregnant,” describing the structure of the candlestick. The structure imitates the image of a pregnant lady.
Structure
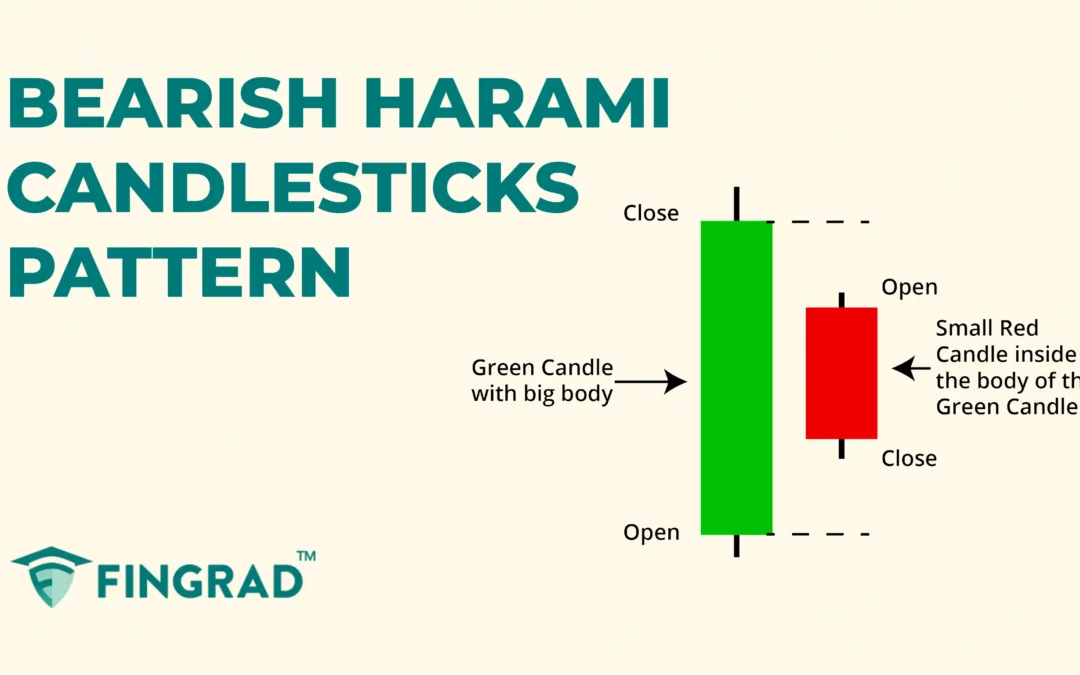
The Bearish Harami candlestick is spotted at the top of the price action.
- First candlestick: It is a bullish candlestick indicating the continuation of the uptrend.
- Second Candlestick: It is a small bearish candlestick whose entire body is contained within the first candlestick’s body, opening below the first candle’s high and closing above its low.

Psychology Behind the Bearish Harami Candlesticks Pattern
- Bullish Candlestick: The security is in an uptrend, the buyers are driving the price to its high, indicating further upward movement.
- Sellers take control and Trend Reversal: The second candlestick opens below the high of the first, reflecting hesitation in the uptrend. Sellers put pressure early, pushing prices down to form a bearish candle, but buyers attempt to defend, causing the candle to close above the first’s low.
This tug-of-war indicates buyers are losing strength, signaling a potential shift in control toward sellers. The sellers take over the trend, overwhelming the buyers, indicating a change in the ongoing uptrend.
How to Trade Bearish Harami?
Entry:
- An entry to the short position can be planned at the open of the next candle after the pattern formation.
Stop-loss:
- The stop loss for the short position is best placed just above the high of the pattern.
Target:
- The initial target is the next support line according to your risk-reward ratio of 1:1 to 1:2, respectively.
- If there are any candlestick patterns formed indicating a reversal, you can plan an exit.
Example Scenario: In the image below, you can look at the chart of “Wipro Ltd” stock at a 1-hour timeframe on 17th September 2024. You can see the sell signal generated by the Bearish harami candlestick as it is a trend reversal.

What are the advantages of the Bearish Harami Candlestick?
- Using the Bearish Harami pattern, you receive an early indication of a possible trend reversal, helping you position for upcoming price changes, though it may not capture the entire move.
- The Bearish Harami pattern is easy to identify and trade for beginners.
- The Bearish Harami pattern is relatively easy for beginners to spot and trade. When combined with a proper stop-loss, it can offer a favorable risk-reward setup.
- The Bearish Harami pattern is versatile across all timeframes and security trading markets, as a single strategy applies to all markets.
What are the disadvantages of the Bearish Harami Candlestick?
- The Bearish Harami pattern indicates the potential reversal, but it does not display the strength of the upcoming reversal pattern.
- In sideways markets, due to a lack of volume in the security, the Bearish Harami pattern might result in a false signal.
- The Bearish Harami pattern lacks confirmation within the pattern, making it dependent on the following candlesticks.
In Closing
In this article, we have explored the Bearish Harami candlesticks pattern, its structure, the psychological pattern, how to trade it with an example of a trade scenario, its application, its advantages, and its disadvantages.
The Bearish Harami candlestick pattern serves as a useful tool to signal potential bearish reversals, particularly in an uptrend, but should be used alongside other confirmations for greater reliability. At the same time, the Bearish Harami offers multiple opportunities for beginners with clear entry and exit signals and making it an accessible and reliable pattern to trade.
Across the financial markets all over the world, no indicator or tool is 100% accurate, and when the Bearish Harami candlestickspattern is combined with additional indicators or tools like RSI, MACD or other tools, its efficiency and accuracy increase rapidly, and with proper risk management, discipline, and back testing of the strategy can pave the path to profitability.
