
For traders seeking easily identifiable and impactful trend reversal signals. Then you must learn about the chart patterns, as they have a huge potential for trend reversal and are easy to spot and trade with minimal risk. Then, the Falling wedge pattern you should know, as they have a huge impact in identifying trend continuation and potential reversal.
In this article, we will discuss the Falling Wedge pattern, its structure, how to identify and trade the pattern with an example, its advantages, and its disadvantages.
What is the Falling Wedge pattern?
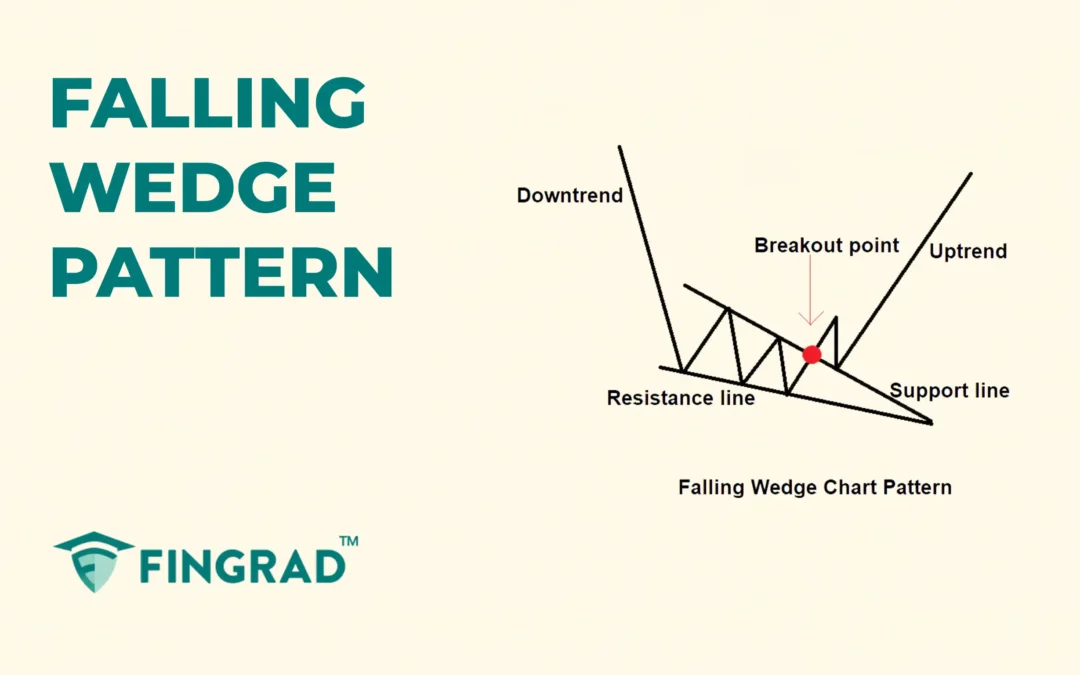
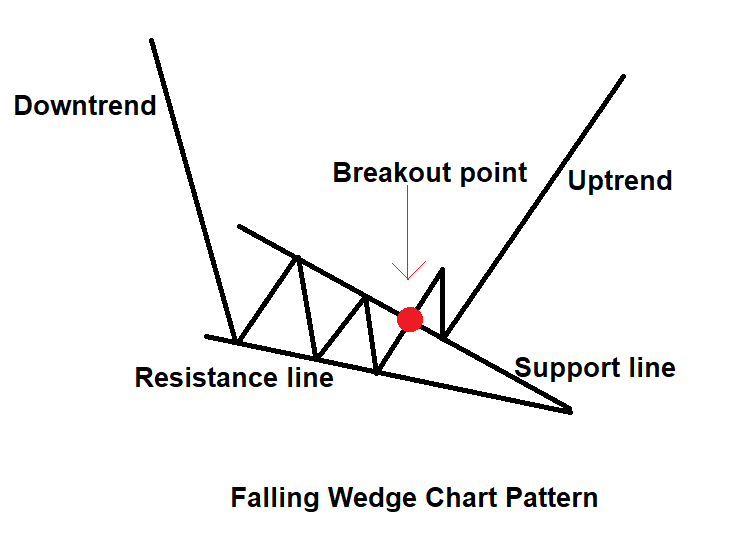
The Falling wedge pattern is a bullish chart pattern formed during the price consolidation between two downward-sloping, converging trendlines. The formation of the pattern with a prior downtrend indicates a bullish reversal.
It suggests that although the price of the security is falling, the downward momentum is slowing, and a reversal to the upward trend is ahead.
The Falling Wedge pattern can form over days, weeks, or even months, depending on the following price action and time frame.
Structure of the Falling Wedge Pattern
The Falling Wedge Pattern is spotted at the bottom of the price chart.
- Two Converging Trendlines: In an ongoing trend, two trend lines are drawn sloping downward to connect the lower highs and lower lows.
The upper trendline acts as a strong resistance line, and the lower trendline acts as a strong support line for price action.
- Declining Volume: During the formation of the pattern, there is a slow decrease in trading volume, a sign of weakening selling pressure.
- Breakout Direction: A confirmed breakout above the upper trendline indicates a valid bullish entry for the Falling Wedge pattern.
- Measuring target: Measure the height of the wedge and then project that distance upward from the breakout point.
How to trade the Falling Wedge pattern?
Entry:
- Plan an entry to the long position at the opening of the candlestick that opens after the breakout candle of the Falling Wedge pattern.
Stop-loss:
- Place a stop-loss below the most recent swing low of the Falling Wedge pattern.
Target:
- Set the primary target using the measured height of the back of the wedge and projected from the breakout point.
- Or adjust it according to your trading strategy, which provides a higher risk-reward ratio for you.
Example:
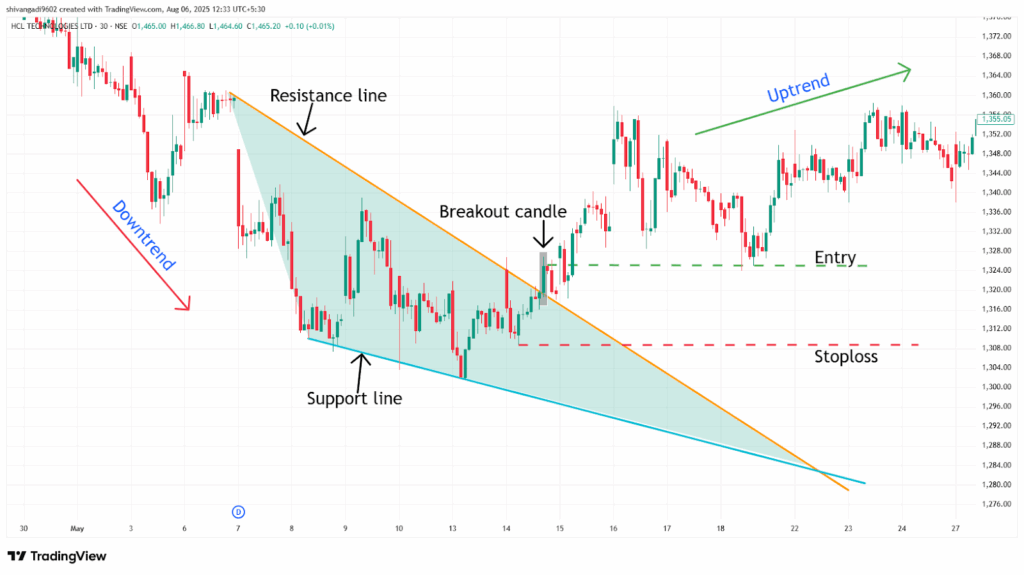
In the image below, you can refer to the chart of the “ HCL Technologies Ltd” stock at a 30-minute timeframe from 6th to 14th May 2024, and you can see the buy signal generated by the Falling Wedge breakout and subsequent uptrend.
What are the advantages of the Falling Wedge Pattern?
- The Falling Wedge pattern provides a high-risk-reward ratio and a strong bullish reversal and continuation signal.
- The Falling Wedge pattern is versatile across all timeframes and all other security markets, as a single strategy can be applicable for all markets.
- The Falling Wedge pattern provides a clear entry, exit, and target to trade for everyone.
What are the disadvantages of the Falling Wedge pattern?
- In the Falling Wedge pattern without a volume spike on breakout, the signal can be weak or unreliable, resulting in a false trade.
- For a strong bullish breakout, the Falling Wedge pattern is dependent on the following volume on the buying side.
- The Falling Wedge pattern is hard to identify, especially in volatile markets or uncertain price action.
In Closing
In this article, we discussed the Falling Wedge pattern, its structure, how to identify it, how to trade it, along with an example, its advantages, and disadvantages.
The Falling Wedge pattern is a powerful tool that signals potential bullish reversals and continuation of bullish momentum in the ongoing uptrend, and it indicates multiple opportunities for clear entry and exit signals.
Your profitability depends on your approach to the trade, your risk management, and your mindset when you are holding the trade, as no indicator or tool is 100% accurate, and the Falling Wedge pattern is combined with additional indicators or tools (RSI, MACD, or others), its efficiency and accuracy increase rapidly.
