
If you rely on technical analysis, you’ve likely come across powerful indicators and tools during your trade, such as candlestick patterns, which visually represent price action and help traders spot potential reversals or continuations of the security, making it easy to trade.
In this article, we will discuss the Bearish Flag Pattern, its structure, how to identify it, how to trade it with an example, its advantages, and its disadvantages.
What is the Bearish Flag pattern?
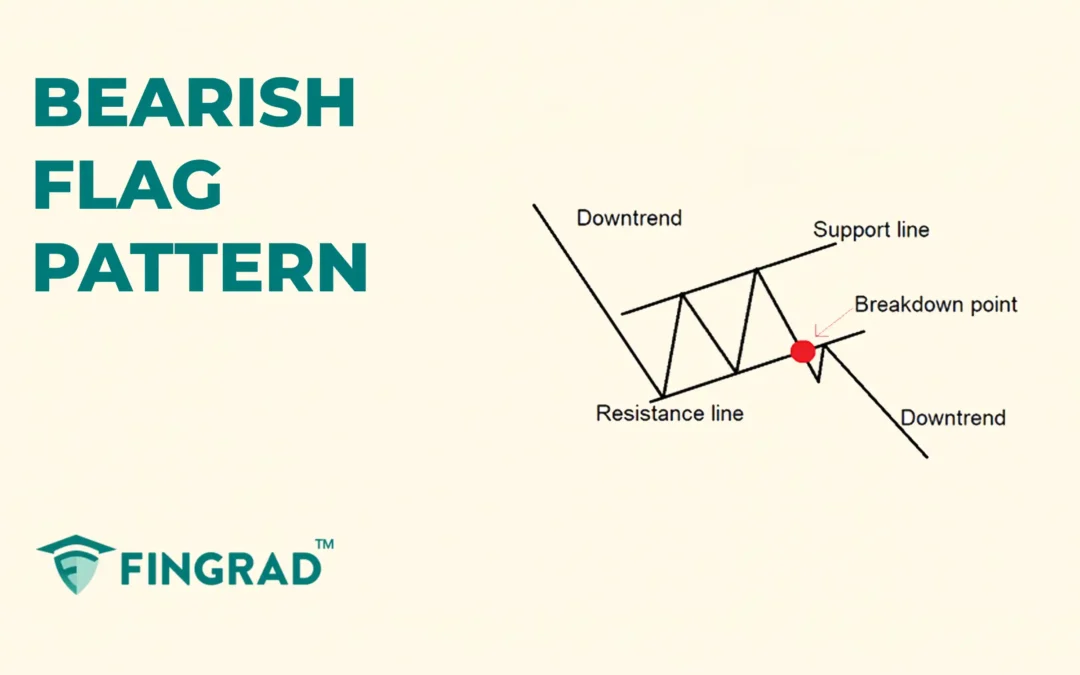
The Bearish Flag Pattern is a technical pattern that indicates a continuation pattern forms after a strong downward price move, followed by a brief consolidation phase that typically slopes upwards or is horizontal, representing a temporary pause before the downtrend continues. The pattern can be formed over days, weeks, or even months, depending on price action.
Once this consolidation of the price is over, the price typically breaks down to continue a strong bearish trend.
Structure
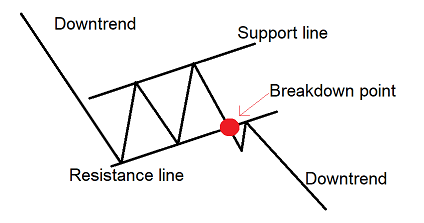
The Bearish Flag Pattern is spotted in the middle of a downtrend.
- Flagpole: A sharp downward move of the price with strong bearish momentum and volume spike on breakdown.
- Flag: It is a tight consolidation phase forming an upward or horizontal channel. It shows temporary consolidation, not reversal.
- Breakout: When a bearish candlestick breaks the support line below it indicates the continuation of the downtrend ahead.
How to identify the Bearish Flag Pattern?
Spot the security trading in a strong downtrend, look for the sideways or upward-sloping channel that forms after the initial downward price move, and as the price is consolidating within two parallel lines sloping upward or flat.
Wait for a breakout candlestick: A confirmed break below the support line is your signal to trade the security in a downward direction.
Calculate the target: Measure the height of the flagpole, and project that distance downward from the breakout point.
How to trade the Bearish Flag Pattern?
Entry:
- Enter a short position in the security when the candle breaks and closes below the flag of the pattern formed.
Stop-loss:
- Place the stop-loss above the most recent swing high.
- Or you can place a stop-loss at the top of the flagpole; if you place the stop-loss at the top of the flagpole, it can result in a poor risk-to-reward ratio.
Target:
- Set the primary target based on the measured distance from the breakdown point of the bearish flag pattern.
- In an ongoing short trade, if you spot any candlestick or pattern signalling a bullish reversal, then book partial profit or trail your stop-loss.
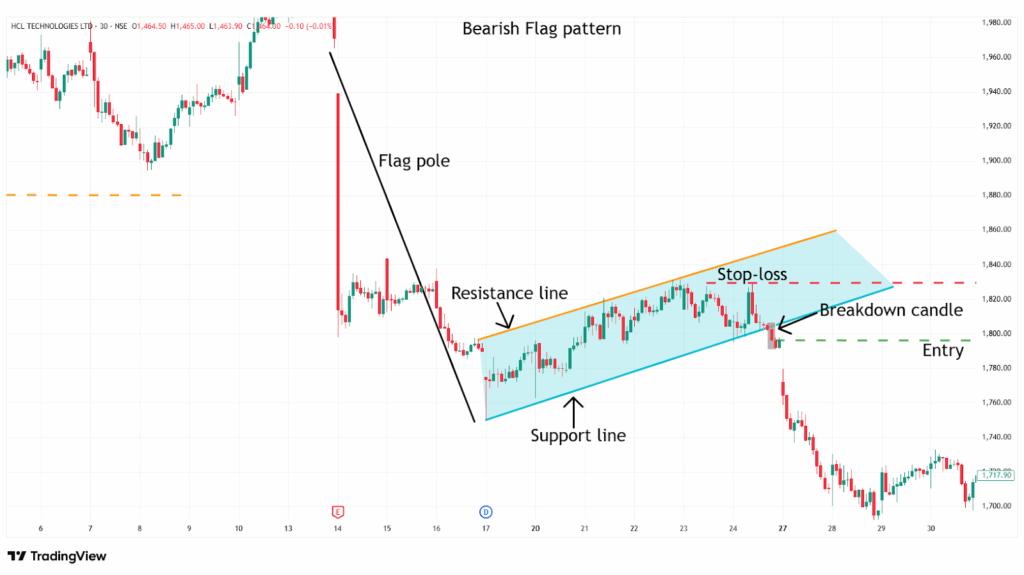
Example:
In the image below, you can refer to the chart of the “ HCL Technologies Ltd” stock at a 30-minute timeframe from 16th to 24th January 2025, and you can see the sell signal generated by the Bearish Flag pattern.
What are the advantages of the Bearish Flag Pattern?
- The Bearish Flag pattern provides a strong and reliable bearish continuation signal.
- The Bearish Flag pattern provides a clear entry, exit, and target to trade for everyone.
- The Bearish Flag pattern is versatile across all timeframes and all other security markets, as a single strategy can be applicable for all markets.
What are the disadvantages of the Bearish Flag pattern?
- For a strong breakdown, the Bearish Flag pattern is dependent on the following volume on the selling side.
- The Bearish Flag pattern is hard to identify, especially in volatile markets or uncertain price action.
- In the Bearish Flag pattern without a volume spike on breakdown, the signal can be weak or unreliable, resulting in a false trade.
In Closing
In this article, we covered the Bearish Flag pattern, its structure, how to identify the pattern, how to trade it, along with an example, its advantages, and disadvantages.
The Bearish Flag pattern is a powerful tool that signals the potential bearish continuation in the ongoing downtrend, and it indicates multiple opportunities for clear entry and exit signals.
Your profitability depends on your approach to the trade, your risk management, and your mindset when you are holding the trade, as no indicator or tool is 100% accurate, and when the Bearish Flag pattern is combined with additional indicators or tools (RSI, MACD, or others), its efficiency and accuracy increase rapidly.
