
If your trading is based on technical analysis using tools and indicators, then it is important to understand the powerful chart pattern, as it identifies potential reversals and continuations of the trend while providing a better understanding of the market sentiment and price action. Among the most reliable bearish continuation patterns is the Bearish Symmetrical Triangle chart pattern, especially during the market’s ongoing downtrend.
In this article, we will understand the Bearish Symmetrical Triangle Chart Pattern, its structure, how to identify it, how to trade it with an example, its advantages, and disadvantages.
What is the Bearish Symmetrical Triangle chart pattern?
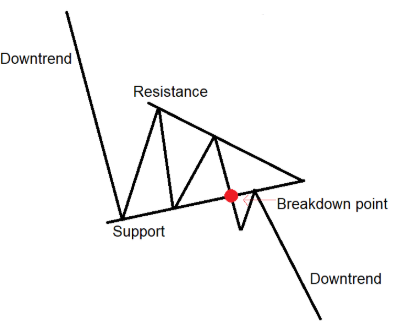
The Bearish Symmetrical Triangle Chart Pattern is a consolidation pattern. It forms when the price moves within two converging trendlines before a bearish breakdown. Two converging trendlines define the range; the line above is the resistance line, and the line below is the support line in an ongoing downtrend.
The Bearish Symmetrical Triangle pattern can form over days, weeks, or even months, depending on the price action.
Once this consolidation of the price is over, the price typically breaks down to begin a strong bearish trend after the pattern is formed.
Structure:
- Converging Trendlines: On the price chart, two trendlines are drawn in an ongoing downtrend.
- Upper trendline: It is drawn by connecting a series of lower highs.
- Lower trendline: It is drawn by connecting a series of higher lows.
For a valid pattern, the price should touch each trendline at least two to three times.
- Interpretation: After a strong downtrend, the pattern is formed during the consolidation, or a small pullback of the price.
- Breakout Confirmation: The pattern breakdown is confirmed only when the bearish candle closes below the support line of the pattern.
How to identify the Bearish Symmetrical Triangle Pattern?
Identify the security in a downtrend, and wait for a pullback in the price, as the price forms lower highs and higher lows, draw two trendlines connecting them, which converge toward a point, forming a triangle.
As price consolidates, the trading volume decreases, signalling uncertainty in price action and reduced volatility of the security.
Wait for a breakdown candlestick: The pattern is confirmed when the price closes below the support line, and the signal to trade the security in a downward direction.
How to trade the Bearish Symmetrical Triangle chart pattern?
Sell signal:
Entry:
- Enter a short position when the candle closes below the lower trendline of the bearish symmetrical triangle pattern formed.
Stop-loss:
- Place the stop-loss at the high of the most recent swing top within the triangle.
Target:
- Measure the height of the triangle at its widest point, project that distance from the breakdown point, and set the target.
Target Price = Breakout Point – (Height of the Triangle)
- Or place your target according to your risk-reward ratio of 1:1, 1:2, or higher.
Example:
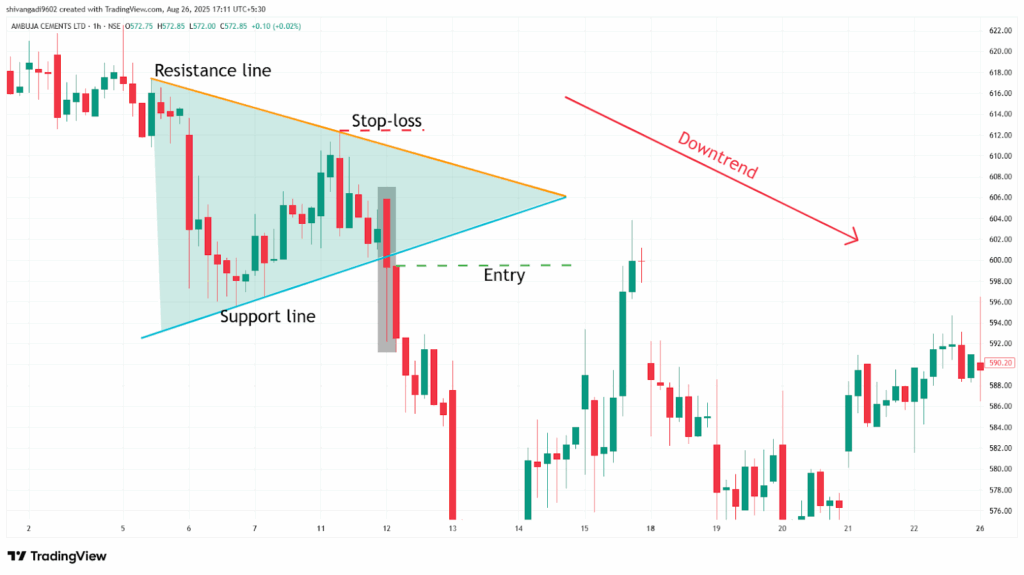
The chart below shows an example of “Ambuja Cements Ltd” stock at a 1-hour timeframe, and you can see the sell signal generated by the Bearish Symmetrical Triangle Chart Pattern.
What are the advantages of the Bearish Symmetrical Triangle Pattern?
- The Bearish Symmetrical Triangle pattern is one of the highly reliable bearish continuation patterns in technical analysis.
- The trendline of the Bearish Symmetrical Triangle pattern acts as a strong resistance after the breakdown of the pattern.
- The Bearish Symmetrical Triangle pattern provides a clear entry, stop-loss, and target for everyone.
- The Bearish Symmetrical Triangle pattern is versatile across all timeframes and all other security markets, as a single strategy can be applicable for all markets.
What are the disadvantages of the Bearish Symmetrical Triangle pattern?
- False breakouts can happen in a Bearish Symmetrical Triangle when the price moves below the trendline with low volume and then it quickly reverses, especially during a sideways market.
- By the time the Bearish Symmetrical Triangle pattern confirms, much of the move may have already happened.
- The Bearish Symmetrical Triangle pattern often takes a long time to develop, especially on higher timeframes.
In Closing:
In this article, we explored the Bearish Symmetrical Triangle pattern, its structure, how to identify it, how to trade it, along with an example, its advantages, and disadvantages.
The Bearish Symmetrical Triangle pattern is a powerful tool used to identify potential bearish continuation in the ongoing downtrend after a small pullback, and it indicates multiple opportunities for clear entry and exit signals for everyone.
Your profitability depends on your approach to the trade, your risk management, and your mindset when you are holding the trade, as no indicator or tool is 100% accurate, and when the Bearish Symmetrical Triangle pattern is combined with additional indicators or tools (RSI, MACD, or others), its efficiency and accuracy increase rapidly.
