

In trading, tools are widely used in technical analysis to study price movements and predict future market behaviour. These patterns reflect the ongoing battle between buyers and sellers, helping traders identify potential trend continuations or reversals with better accuracy. One such important bearish reversal formation is the Pipe Top pattern, which signals a possible shift from an uptrend to a downtrend.
In this article, we will understand the Pipe Top Pattern, its structure, how to identify it, how to trade it with an example, its advantages, and disadvantages.
What is the Pipe Top Pattern?
The Pipe Top Pattern is a bearish reversal candlestick pattern used to identify potential trend reversals from bullish movement to bearish movement.
The Pipe Top Pattern is formed after a strong uptrend when two or more consecutive candlesticks (usually with long bodies) appear at or near the same high price level.
Structure
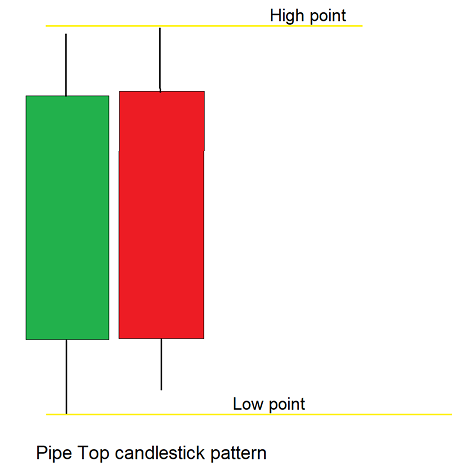
- In an ongoing uptrend, two or more tall bullish candlesticks are followed by similar-sized bearish candlesticks.
- The highs of both the candles are roughly equal, forming a “pipe” like structure.
- During the formation of the second candle, there is an increase in volume, indicating the potential bearish reversal. If the reversal candle forms on low volume, the pattern may be weaker or result in a pattern failure.
How to identify the Pipe Top candle pattern?
First, identify a security in an uptrend. Wait for the long bullish candle followed by the long bearish candle in the price chart. The pattern is confirmed when the bearish candle closes near the opening price of the previous candle, with only a slight difference.
When the following bearish candle trades below the low of the previous candle, there is an increase in the volume on the selling side, validating the pattern reversal.
How to trade the Pipe Top candle pattern?
Sell signal:
Entry:
- Enter a short position in the security at the close of the next candle formed after the pattern formation.
Stop-loss:
- Set the stop-loss at the high of the Pipe Top pattern.
Target:
- Set the target at the next support line of the price action.
- According to your trading strategy, set your target as per your risk management.
Example:
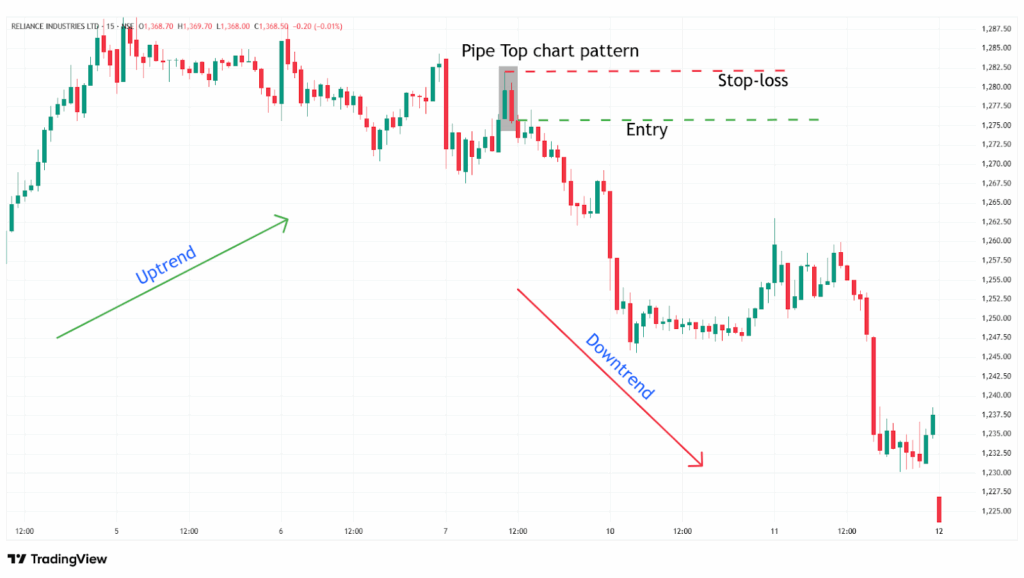
The chart below shows an example of “RIL Ltd” stock at a 15-minute timeframe on 7th February 2025, and you can see the sell signal generated by the Pipe Top pattern.
What are the advantages of the Pipe Top candle pattern?
- The Pipe Top is one of the highly reliable bearish reversal patterns in technical analysis.
- The Pipe Top pattern acts as a strong resistance level after the breakdown of the pattern.
- The Pipe Top pattern provides a clear entry, stop-loss, and target for everyone.
- The Pipe Top pattern is versatile across all timeframes and all other security markets, and as a single strategy, it can be applicable for all markets.
What are the disadvantages of the Pipe Top candle pattern?
- The Pipe Top pattern is dependent on the following candlestick to confirm the reversal, especially in low-volume market conditions, in which the pattern fails to signal a reversal.
- By the time the Pipe Top pattern confirms, much of the move may have already happened, as breakouts can occur quickly and reverse just as fast.
- In the Pipe Top pattern, the entry is delayed, and stop-loss placement may be wider, giving a higher risk for a lower reward.
In Closing
In the article, we learned the Pipe Top candle pattern, its structure, how to identify the pattern, how to trade it, along with an example of a past pattern formed, its advantages, and disadvantages.
The Pipe Top pattern helps traders identify potential bearish reversals during ongoing uptrends, offering clear entry and exit signals for everyone.
Your profitability depends on your approach to the trade, your risk management, and your mindset when you are holding the trade, as no indicator or tool is 100% accurate in financial markets across the world, and as the Pipe Top candle pattern’s efficiency and accuracy increase rapidly when it is combined with additional indicators or tools (RSI, MACD, or others).
