
In trading, technical analysis is widely used to study price movements and identify patterns that reveal market behaviour. These patterns help traders anticipate whether a trend will continue or reverse, giving them an edge in planning entries and exits. One such important formation is the Ascending Channel pattern, known for signalling both continuation and potential reversal opportunities within an uptrend.
In this article, we will understand the Ascending Channel chart pattern, its structure, how to identify it, how to trade it with an example, its advantages, and disadvantages.
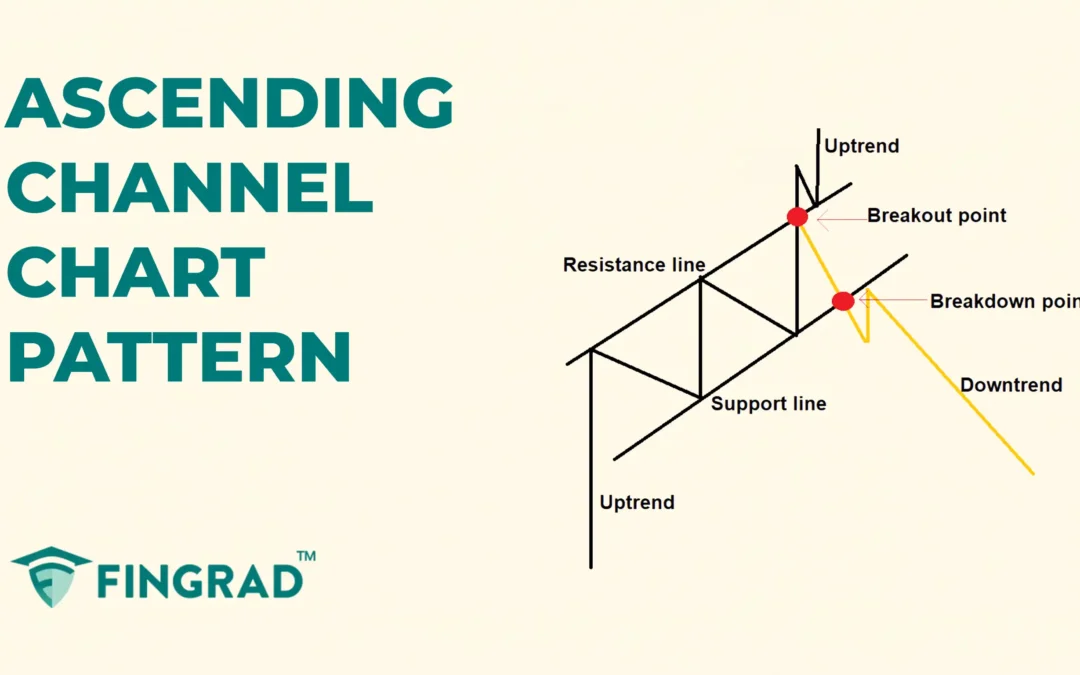
What is the Ascending Channel Chart Pattern?
The Ascending Channel pattern is primarily a continuation/consolidation pattern, but can act as a reversal if broken to the downside. The price moves within two parallel upward-sloping trendlines before a strong breakout or breakdown in an ongoing uptrend. Two parallel trendlines define the range of the price; the line above acts as a resistance line, and the line below acts as the support line in an ongoing uptrend.
Once this consolidation of the price is over, the price typically breaks out to begin a strong bullish trend or price breaks down to begin a strong bearish trend after the pattern is formed.
The Ascending Channel pattern appears when the price is making higher highs and higher lows over time, and the pattern can form over days, weeks, or even months, depending on the price action.
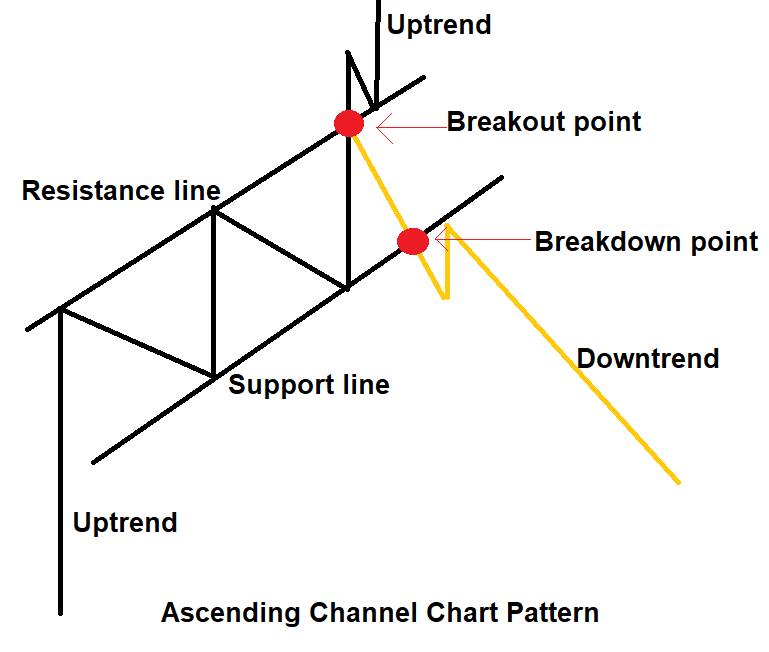
Structure:
- Parallel Trendlines: On the price chart, two trendlines are drawn in an ongoing uptrend.
- Upper trendline: The upper trendline slopes upward, connecting a series of higher highs.
- Lower trendline: The lower trendline slopes upward, connecting a series of higher lows.
The price should touch each trendline at least two to three times for a valid pattern.
How to identify the Ascending Channel chart pattern?
First, identify a security in an uptrend. Wait for the price to form higher highs and higher lows. Then draw two parallel trends connecting a series of higher highs and higher lows, and the upper trendline connecting higher highs acts as a strong resistance line, and the trendline connecting higher lows acts as a strong support line.
- Breakout Confirmation: The pattern breakout is confirmed when the bullish candle closes above the upper trendline of the pattern, indicating a change in movement to a strong bullish trend.
- Breakdown Confirmation: The pattern breakdown is confirmed when the bearish candle closes below the lower trendline of the pattern, indicating a change in movement to a strong bearish trend.
After the breakout or the breakdown candle, there is a rapid increase in the volume, validating the pattern formation.
How to trade the Ascending Channel chart pattern?
Buy signal:
Entry:
- Enter a long position in the security when the candle closes above the upper trendline of the pattern formed.
Stop-loss:
- Place the stop-loss at the low of the most recent swing bottom on the lower trendline.
Target:
- Measure the channel height and project it upward from the breakout point, and set the target.
Target Price = Breakout Price + Channel height
- Or place your target according to your risk-reward ratio of 1:1, 1:2, or higher as per your trading strategy.
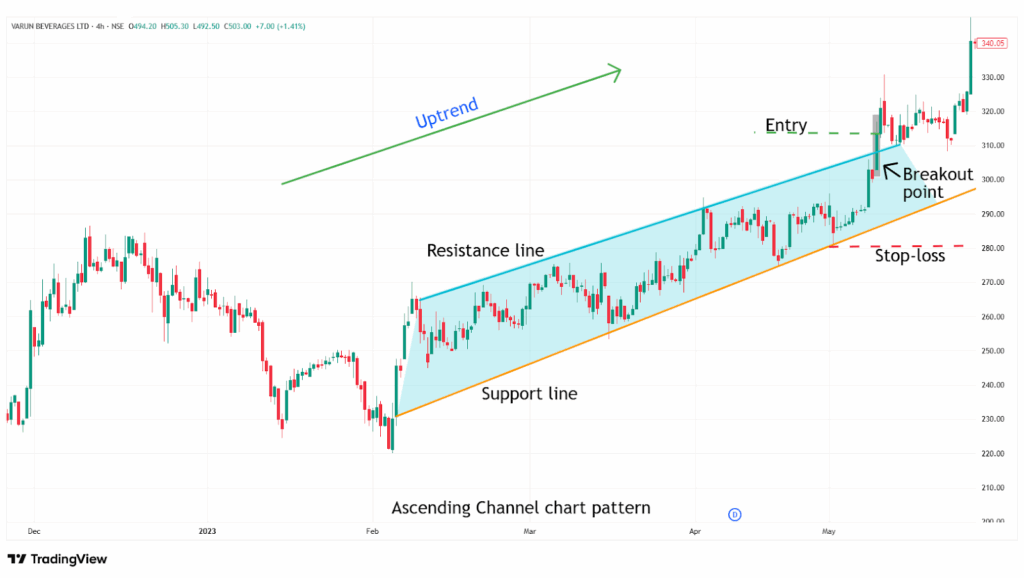
Example:
The chart below shows an example of “ Varun Beverages Ltd” stock at a 4-hour timeframe from 6th February to 10th May 2023, and you can see the buy signal generated by the Ascending Channel chart pattern.
Sell signal:
Entry:
- Enter a short position in the security when the candle closes below the lower trendline of the pattern formed.
Stop-loss:
- Place the stop-loss at the high of the most recent swing top on the upper trendline.
Target:
- Measure the channel height and project it downward from the breakout point, and set the target.
Target Price = Breakout Price – Channel height
- Or place your target according to your risk-reward ratio of 1:1, 1:2, or higher as per your trading strategy.
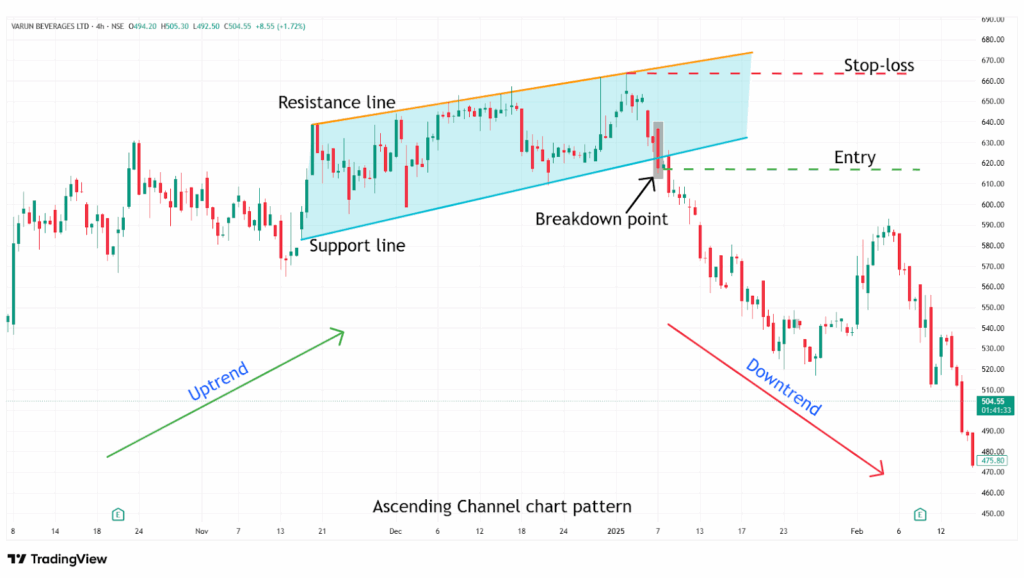
Example:
The chart below shows an example of “ Varun Beverages Ltd” stock at a 4-hour timeframe from 18th November 2024 to 7th January 2025, and you can see the sell signal generated by the Ascending Channel chart pattern.
What are the advantages of the Ascending Channel Chart Pattern?
- The Ascending Channel provides a clear understanding of the price action and indicates clear entry, stop-loss, and target for everyone.
- The Ascending Channel is versatile across all timeframes and all other security markets, as a single strategy, can be applicable for all markets.
- The Ascending Channel pattern acts as a strong resistance level after the breakdown of the pattern.
- The channel height helps in calculating target levels after a breakout or breakdown.
The disadvantages of the Ascending Channel chart pattern:
- False breakouts can happen in an Ascending Channel when the price moves below the trendline with low volume, only to quickly reverse, especially in low-volume or sideways market conditions.
- By the time the Ascending Channel confirms, much of the move may have already happened.
- The Ascending Channel often takes a long time to develop, especially on higher timeframes.
In Closing
In this article, we learned the Ascending Channel chart pattern, its structure, how to identify it, how to trade it, along with an example, its advantages, and disadvantages.
The Ascending Channel chart pattern is a powerful tool that signals potential reversals and continuation in the ongoing uptrend, indicating multiple opportunities for clear entry and exit signals.
Your profitability depends on your approach to the trade, your risk management, and your mindset when you are holding the trade, as no indicator or tool is 100% accurate, and as the Ascending Channel chart pattern’s efficiency and accuracy increase rapidly when it is combined with additional indicators or tools (RSI, MACD, or others).
