
In trading, technical analysis plays a crucial role in helping traders understand price behaviour and predict future market trends. By studying chart patterns, traders can identify potential opportunities for entry and exit with better accuracy. Among the many reliable patterns, the Rounding Bottom stands out as a classic formation that signals a possible bullish reversal after a prolonged downtrend.
In this article, we will understand the Rounding Bottom Pattern, its structure, how to identify it, how to trade it with an example, its advantages, and disadvantages.
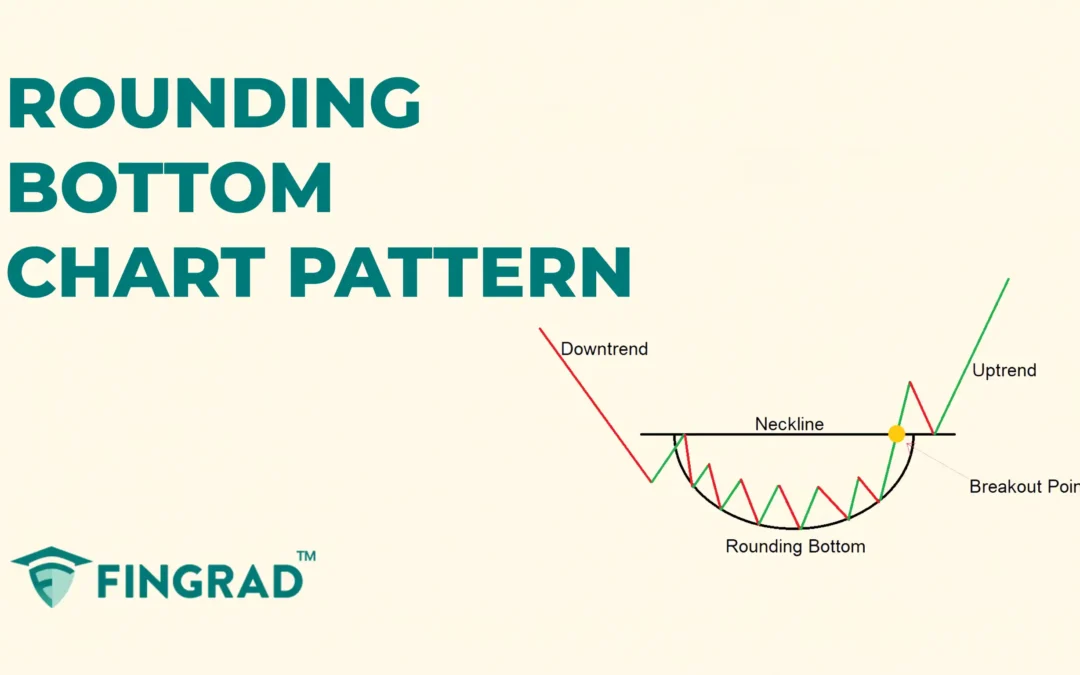
What is the Rounding Bottom Pattern?
The Rounding Bottom Pattern is a powerful chart pattern used by traders to identify the potential bullish reversals in an ongoing downward trend by forming a “U” shape curve.
The pattern resembles a bowl shape, due to the curved bottom with smooth edges, rather than sharp peaks or drops.
The term “Rounding Bottom” refers to the structure of the pattern, which resembles a half circle.
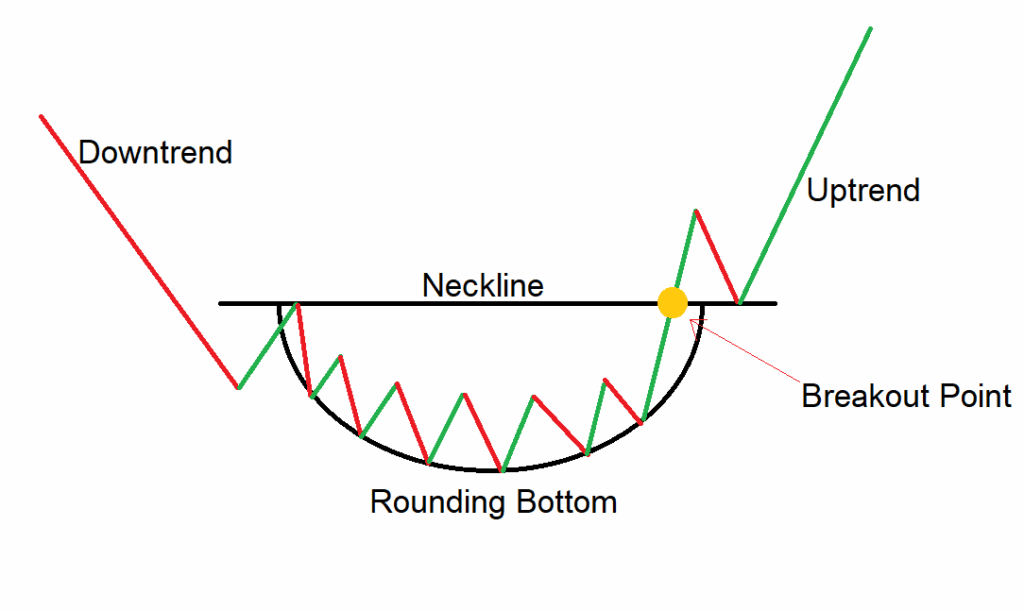
Structure
- Rounding Bottom: A group of candles is formed in a rounded ‘U’-shape where the price of the security gradually declines over time, to the bottom, and then slowly begins to rise, and it closes at or near the opening price range of the pattern.
- Neckline: It is a flat or horizontal resistance line drawn by connecting the highest points on the left and right sides of the Rounding Bottom pattern.
- Breakout: After the formation of the Rounding Bottom pattern is completed, a strong bullish candle is formed that closes above the resistance level, signaling a potential bullish move.
How to identify the Rounding Bottom pattern?
Identify a security in a downtrend and wait for the price to consolidate slowly and rise back up, forming a “U” shape price action on the chart, then draw a horizontal trendline connecting the high of the candle from start to stop point, forming the pattern. The sides of the Rounding Bottom should be smooth and about the same height.
After the consolidation, wait for the breakout candle to form, the candle that closes above the neckline of the Rounding Bottom pattern, followed by an increase in volume on the buying side for the breakout confirmation, indicating strong participation and reversal of the ongoing downtrend.
How to trade the Rounding Bottom chart pattern?
Target Strategy:
Entry:
- Enter a long trade in the security at the closing price of the candle that closes above the neckline of the rounding bottom chart pattern.
Stop-loss:
- Place the stop loss below the lowest point of the Rounding Bottom.
Target:
- Place the target by measuring the depth of the Rounding Bottom and projecting it upward from the breakout point.
Target Price = Breakout Level + Rounding Bottom Depth
- Or set your target to the next resistance level or according to your preferred risk-reward ratio, such as 1:1, 1:2, or higher.
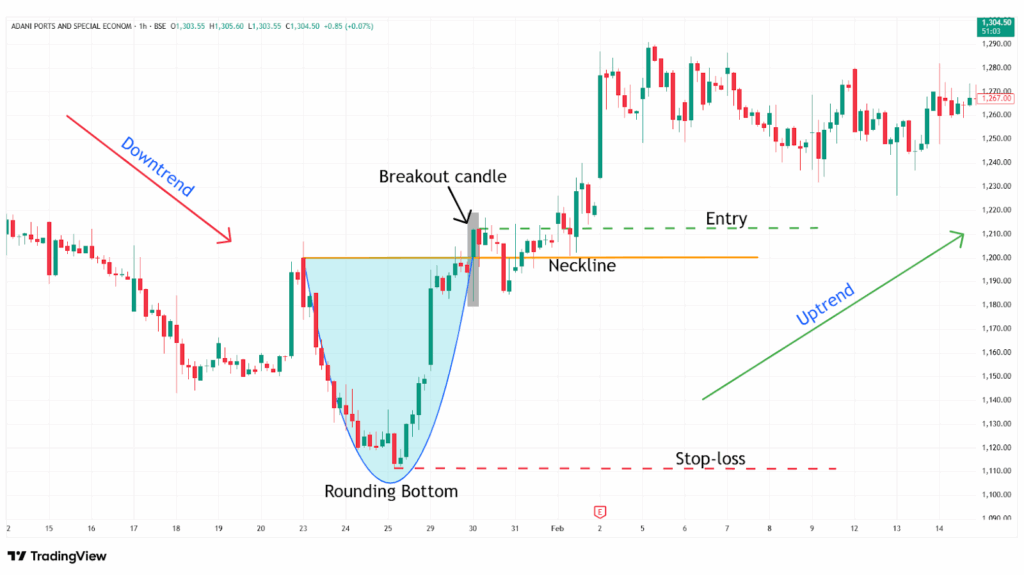
Example:
The chart below shows an example of “Adani Ports Ltd” stock at a 1-hour timeframe from 23rd to 30th January 2025. As you can see, the buy signal was generated by the Rounding Bottom pattern.
What are the advantages of the Rounding Bottom chart pattern?
- The Rounding Bottom pattern provides a clear understanding of the price action and indicates clear entry, stop-loss, and target for everyone.
- The Rounding Bottom pattern is versatile and applicable across all timeframes and markets.
- The Rounding Bottom pattern acts as a strong support level after the breakout of the pattern.
- While trading the Rounding Bottom pattern, the depth of the pattern helps in calculating target levels after a breakout.
The disadvantages of the Rounding Bottom chart pattern
- False breakouts can occur in a Rounding Bottom pattern price may close above the neckline and then reverse, especially in low-activity or choppy markets.
- By the time the Rounding Bottom pattern confirms, much of the move may have already happened, which affects your risk-reward ratio.
- The Rounding Bottom pattern often takes a long time to develop, especially on higher timeframes.
In Closing
In this article, we learned the Rounding Bottom chart pattern, its structure, how to identify it, how to trade it, along with an example, its advantages, and disadvantages.
The Rounding Bottom chart pattern is a powerful tool that signals the potential bullish reversal in the ongoing downtrend, indicating multiple opportunities for clear entry and exit signals.
Your profitability depends on your approach to the trade, your risk management, and your mindset when you are holding the trade, as no indicator or tool is 100% accurate in financial market across the world, and as the Rounding Bottom chart pattern’s efficiency and accuracy increase rapidly when it is combined with additional indicators or tools (RSI, MACD, or others), and traders should backtest this pattern on various timeframes and instruments to better understand its strengths and limitations.
