
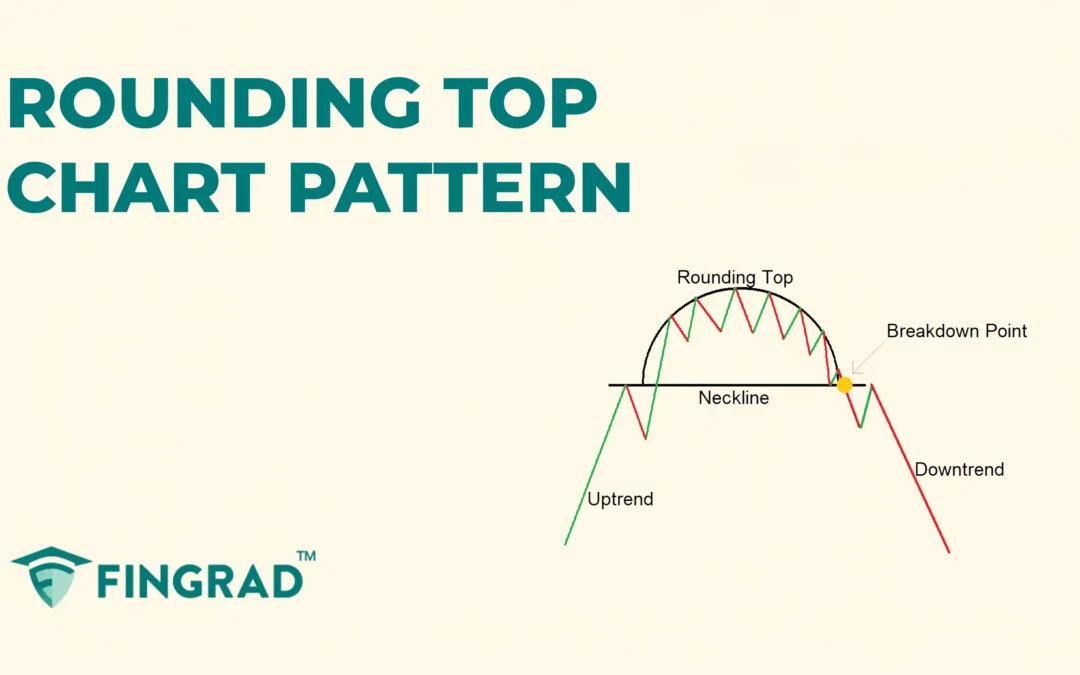
In trading, chart patterns play an important role in understanding market psychology and forecasting price movements. These patterns often highlight areas of potential reversals or continuations, giving traders an edge in planning their entries and exits. One such widely recognised bearish reversal formation is the Rounding Top pattern, which signals a possible shift from an uptrend to a downtrend.
In this article, we will understand the Rounding Top Pattern, its structure, how to identify it, how to trade it with an example, its advantages, and disadvantages.
What is the Rounding Top Pattern?
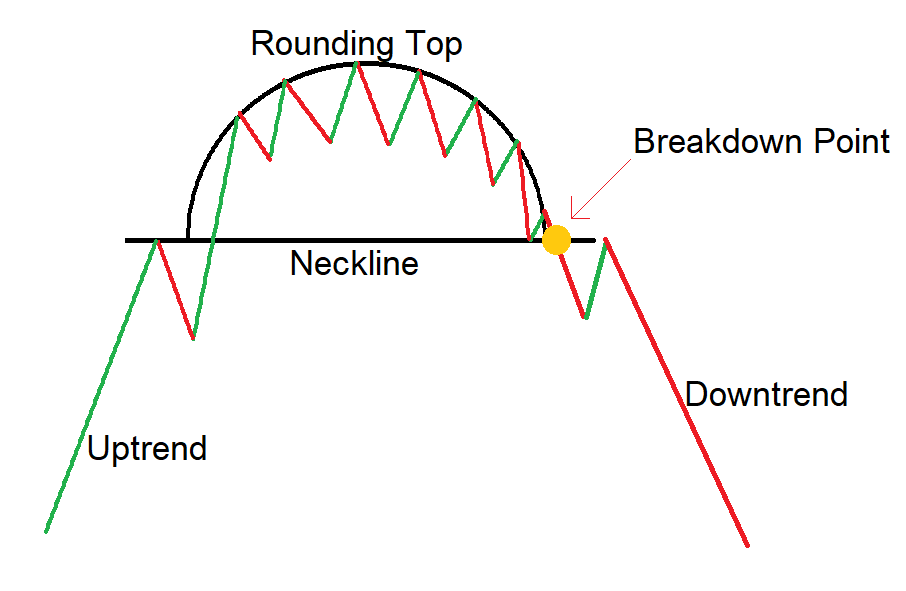
The Rounding Top Pattern is a powerful chart pattern used by traders to identify the potential bearish reversals in an ongoing upward trend by forming a “U” shape curve upside down.
The pattern is also known as the Saucer Top pattern, due to the curved top with smooth edges, rather than sharp peaks or drops.
The term “Rounding Top” refers to the structure of the pattern, which resembles a half circle upside down.
Structure:
- Rounding Top: A group of candles is formed in a rounded ‘U’-shape upside down, where the price of the security gradually rises over time, to the top, and then slowly begins to decline, and it closes at or near the opening price range of the pattern.
- Neckline: It is a flat or horizontal support line drawn by connecting the lowest points on the left and right sides of the Rounding Top pattern.
- Breakdown: After the formation of the Rounding Top pattern is completed, a strong bearish candle is formed that closes below the support level, signalling a potential bearish move.
How to identify the Rounding Top pattern
Identify a security in an uptrend and wait for the price to consolidate slowly and decline back down, forming an inverse “U” shape price action on the chart, then draw a horizontal trendline connecting the lows of the candle from start to stop point, forming the pattern. The sides of the Rounding Top should be smooth and about the same height.
After the consolidation, wait for the breakdown candle to form, the candle that closes below the neckline of the Rounding Top pattern, followed by an increase in volume on the selling side for the breakdown confirmation, indicating strong participation and reversal of the ongoing uptrend.
How to trade the Rounding Top chart pattern
Target Strategy:
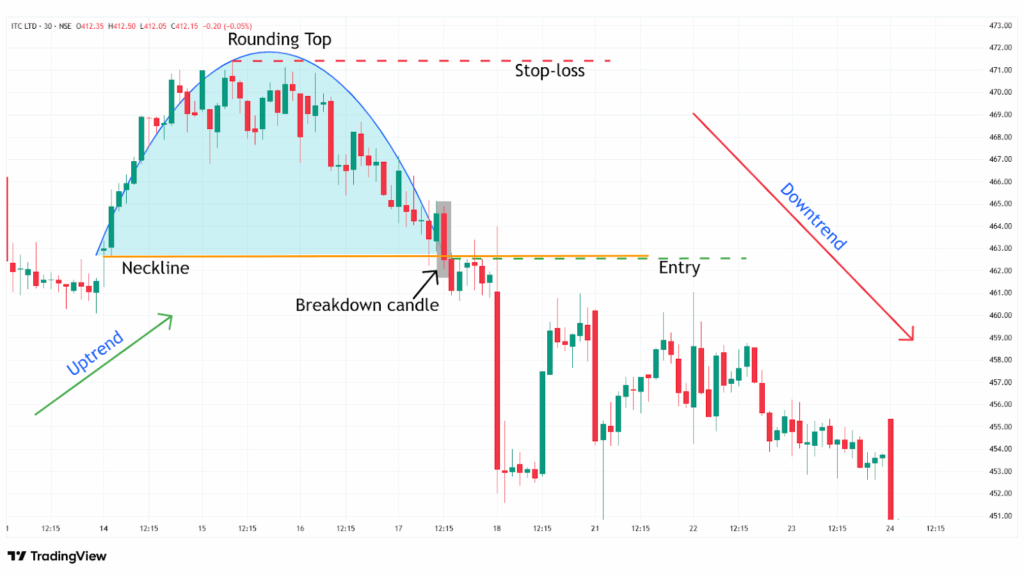
Entry:
- Enter a short trade in the security at the closing price of the candle that closes below the neckline of the rounding top chart pattern.
Stop-loss:
- Place the stop loss above the highest point of the Rounding Top.
Target:
- Place the target by measuring the depth of the Rounding Top and projecting it downward from the breakdown point.
Target Price = Breakdown Level – Rounding Top Depth
- Or set your target to the next support level or according to your preferred risk-reward ratio, such as 1:1, 1:2, or higher.
Example:
The chart below shows an example of “ITC Ltd” stock at a 30-minute timeframe from 14th to 17th October 2024. As you can see, the sell signal was generated by the Rounding Top pattern.
What are the advantages of the Rounding Top chart pattern?
- The Rounding Top pattern provides a clear understanding of the price action and provides clearly defined entry, stop-loss, and target levels.
- The Rounding Top pattern is versatile and applicable across all timeframes and markets.
- The Rounding Top pattern acts as a strong resistance level after the breakdown of the pattern.
- While trading the Rounding Top pattern, the depth of the pattern helps in calculating target levels after a breakdown.
The disadvantages of the Rounding Top chart pattern:
- False breakdown can occur in a Rounding Top pattern, and the price can quickly reverse again, especially in low-volume or sideways market conditions.
- By the time the Rounding Top pattern confirms, much of the move may have already happened, which affects your risk-reward ratio.
- The Rounding Top pattern often takes a long time to develop, especially on higher timeframes.
In Closing
In this article, we learned the Rounding Top chart pattern, its structure, how to identify it, how to trade it, along with an example, its advantages, and disadvantages.
The Rounding Top chart pattern is a powerful tool that signals the potential bearish reversal in the ongoing uptrend, indicating multiple opportunities for clear entry and exit signals.
Your profitability depends on your approach to the trade, your risk management, and your mindset when you are holding the trade, as no indicator or tool is 100% accurate in financial market across the world, and as the Rounding Top chart pattern’s efficiency and accuracy increase rapidly when it is combined with additional indicators or tools (RSI, MACD, or others), and traders should backtest this pattern on various timeframes and instruments to better understand its strengths and limitations.
