
When you begin trading, you would want to avoid unnecessary risky trades. Then, learning chart patterns can help interpret price action and structure trades more efficiently, though they aren’t always easy to identify or trade. They also help you identify the potential reversal and the trend continuation in the price chart. The Rectangle Chart Pattern is one of the highly reliable and efficient chart patterns in identifying the continuation of the ongoing trend.
In this article, we will understand the Rectangle Chart Pattern, its structure, how to identify it, how to trade it with an example, its advantages, and disadvantages.
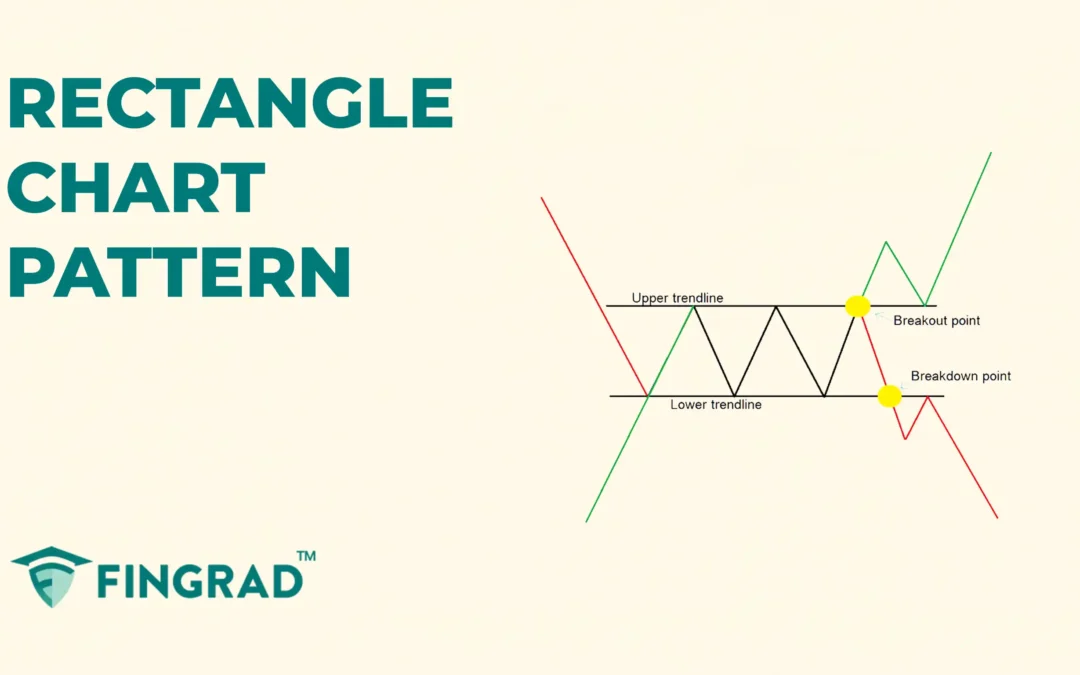
What is the Rectangle Chart Pattern
The Rectangle Chart pattern is primarily a consolidation pattern, a continuation chart pattern that forms when price moves sideways between two parallel horizontal lines.
- If the pattern is formed in an ongoing uptrend, followed by an upward breakout, it is a Bullish Rectangle Chart Pattern.
- If the pattern is formed in an ongoing downtrend, followed by a downward move, it is a breakdown Bearish Rectangle Chart Pattern.
Structure
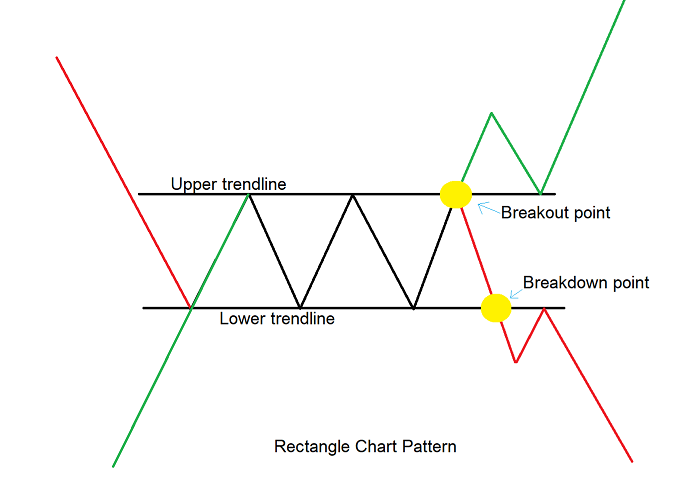
- Parallel Trendlines: On the price chart, two trendlines are drawn in an ongoing trend during the consolidation in the price.
- Upper trendline: A flat or horizontal line is drawn by connecting a series of similar highs, and it acts as a strong resistance line to the price action.
- Lower trendline: A flat or horizontal line is drawn by connecting a series of similar lows, and it acts as a strong support line to the price action.
For a valid confirmation, the candle should touch each trendline at least two times during the price action.
- Breakout Confirmation: The pattern breakout or breakdown is confirmed only when the candle closes above or below the pattern line of the pattern. For a Bullish Rectangle, let the candle close above the upper trendline, and for the Bearish Rectangle, the candle closes below the lower trendline.
How to identify the Rectangle chart pattern?
Bullish Rectangle Chart Pattern:
- First, identify a security in an uptrend, then look for the price consolidation. Then draw two parallel trends according to the structure. Wait for the breakout candle to form.
- As the strong bullish candle closes above the resistance line, the pattern is confirmed, then plan for a long trade.
Bearish Rectangle Chart Pattern:
- First, identify a security in a downtrend, then look for the price consolidation. Then draw two parallel trends according to the structure. Wait for the breakdown candle to form.
- As the strong bearish candle closes below the support line, the pattern is confirmed, then plan for a short trade.
How to trade the Rectangle chart pattern?
Buy signal:
Entry:
- Enter a long position trade when the bullish candle closes above the upper trendline of the pattern formed.
Stop-loss:
- Place the stop-loss at the low of the most recent swing bottom within the rectangle.
Target:
- Set the target by measuring the height of the rectangle at its widest point, and project that distance from the breakout point.
Target = Breakout Price + (Height of the Rectangle)
- Or set based on your preferred risk-reward ratio, depending on your trading strategy.
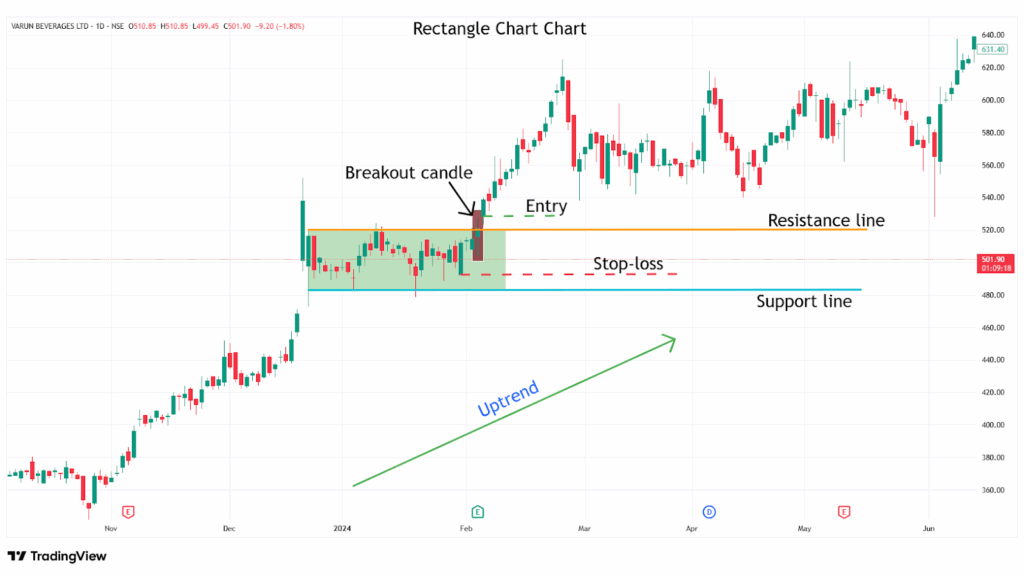
Example:
The chart below shows an example of “Varun Beverages Ltd” stock at a 1-day timeframe from 21st December 2023 to 5th February 2024, and you can see the buy signal generated by the Rectangle chart pattern.
Sell signal:
Entry:
- Enter a short position trade when the candle closes below the lower trendline of the pattern formed.
Stop-loss:
- Set the stop-loss at the high of the most recent swing top within the rectangle.
Target:
- Set the target by measuring the height of the rectangle at its widest point and projecting that distance from the breakdown point.
Target = Breakdown Price – (Height of the Rectangle)
- Or set based on your preferred risk-reward ratio, depending on your trading strategy.
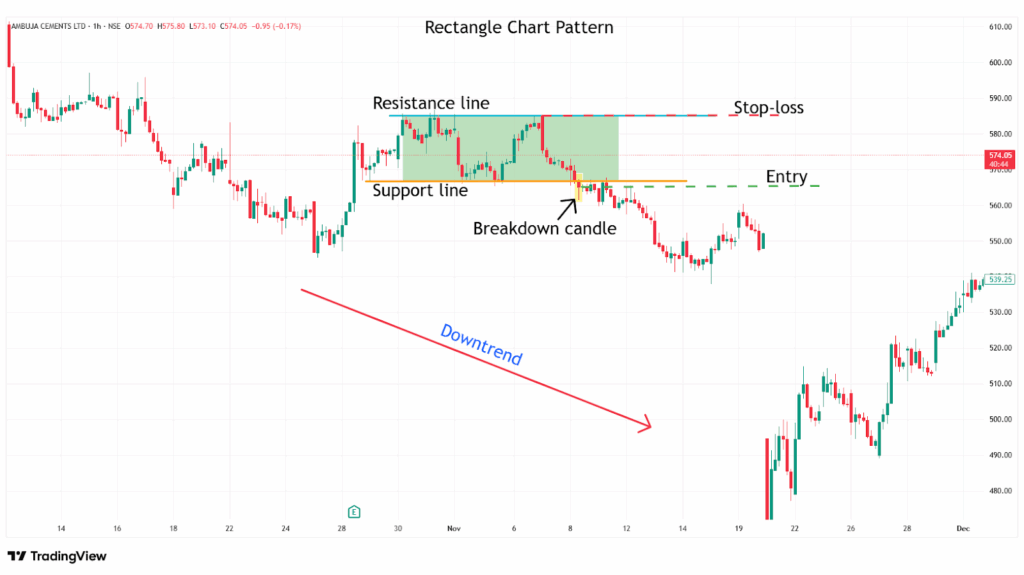
Example:
The chart below shows an example of “Ambuja Cements Ltd” stock at a 1-hour timeframe from 30th October to 5th November 2024, and you can see the sell signal generated by the Rectangle chart pattern.
What are the advantages of the Rectangle chart pattern?
- The Rectangle chart pattern provides a clear understanding of the price action and provides clearly defined entry, stop-loss, and target levels.
- The Rectangle chart pattern is versatile and applicable across all timeframes and markets.
- The Rectangle chart pattern acts as a strong resistance level after the breakdown of the pattern and a strong support level after the breakout.
- While trading the Rectangle chart pattern, the depth of the pattern helps in calculating target levels after a breakout.
The disadvantages of the Rectangle chart pattern:
- A false signal can occur in a Rectangle chart pattern, and the price can quickly reverse again, especially in low-volume or sideways market conditions.
- By the time the Rectangle chart pattern confirms, much of the move may have already happened, which affects your risk-reward ratio.
- The Rectangle chart pattern often takes a long time to develop, especially on higher timeframes.
In Closing
In this article, we learned the Rectangle chart pattern, its structure, how to identify it, how to trade it, along with an example, its advantages, and disadvantages.
The Rectangle chart pattern is a powerful tool that signals the potential reversal in the ongoing trend, indicating multiple opportunities for clear entry and exit signals.
Your profitability depends on your approach to the trade, your risk management, and your mindset when you are holding the trade, as no indicator or tool is 100% accurate in financial market across the world, and as the Rectangle chart pattern’s efficiency and accuracy increase rapidly when it is combined with additional indicators or tools (RSI, MACD, or others), and traders should backtest this pattern on various timeframes and instruments to better understand its strengths and limitations.
