
Technical analysis involves trading with tools and indicators, which are powerful and reliable during your trades. One such pattern is the Volatility Contraction Pattern (VCP), which highlights tightening consolidations and can help plan entries and risk, though it is not always easy to identify or optimal in every market.
In this article, we will discuss the Volatility Contraction Pattern, its structure, how to identify it, how to trade it with an example, its advantages, and disadvantages.
What is the Volatility Contraction Pattern?
The Volatility Contraction Pattern(VCP) is primarily a Contraction pattern that occurs as a stock consolidates. Each successive contraction is smaller than the previous one, reflecting a decrease in volatility and tighter control by institutional investors.
The pattern forms within a base (like a cup-with-handle, flat base, or consolidation area).
The consolidation with lower volatility sets up the stock for a breakout.
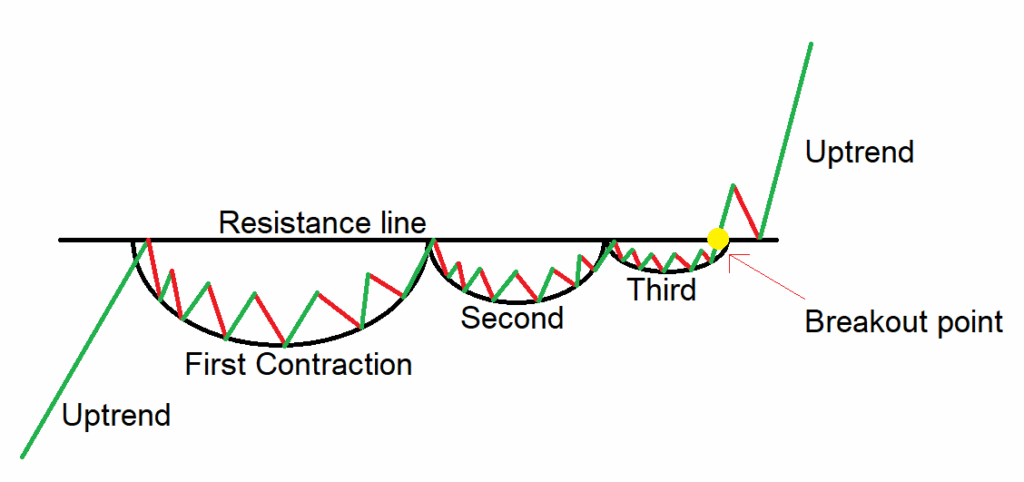
Structure
- First Contraction: The price displays a sharp and wide pullback, often 15–30% or more, setting the foundation of the base.
- Second Contraction: The stock rebounds, then pulls back again, and the decline is smaller than the first, often 10–15%, showing that selling pressure is decreasing.
- Third Contraction: The pattern continues with smaller and smaller pullbacks, and each low is higher than the previous low, and in some cases, you can observe the fourth contraction also.
- Breakout: As the security trades in a very tight price range, a strong bullish candle is formed, and closes above the resistance level with added volume on the buying side, confirming the breakout.
How to identify the Volatility Contraction Pattern?
- First, identify a security in an uptrend, then look for the price consolidation. Then, draw a resistance line connecting the series of highs, and observe how the price contracts. The price contracts more than twice, and each contract is smaller than the previous one, which confirms the pattern forming a higher low on each contract.
- As the strong bullish candle closes above the resistance line, you can see the increase in volume on the buying side, confirming the pattern.
How to trade the Volatility Contraction Pattern?
Buy signal:
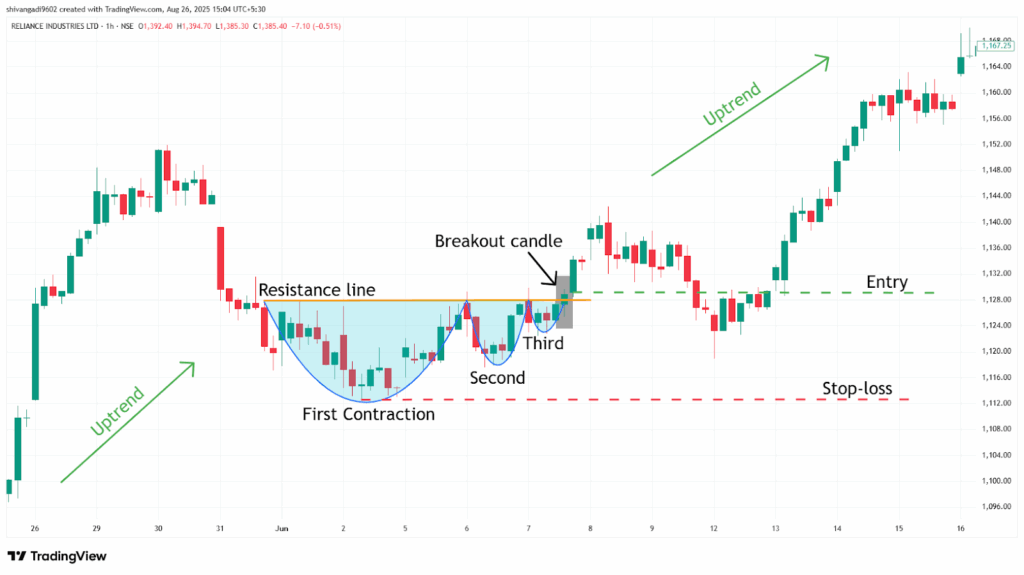
Entry:
- Enter a long trade in the security at the closing price of the candle that closes above the neckline of the chart pattern formed.
Stop-loss:
- Place the stop-loss at the low of the first contraction of the pattern.
Target:
- Set the target by measuring the height of the first contact point, and project that distance from the breakout point in an upward direction.
Target = Breakout Price + ( Height of the Base)
- Or set based on your preferred risk-reward ratio, depending on your trading strategy.
Example:
The chart below shows an example of “RIL Ltd” stock at a 1-hour timeframe from 1st to 7th June 2023, and you can see the buy signal generated by the Volatility Contraction Pattern.
What are the advantages of the Volatility Contraction Pattern?
- The Volatility Contraction Pattern provides a clear understanding of the price action and clearly defined entry, stop-loss, and target levels.
- The Volatility Contraction Pattern is versatile and applicable across all timeframes and markets.
- The Volatility Contraction Pattern acts as a strong support level after the breakout of the pattern.
- While trading the Volatility Contraction Pattern, the contracts of the pattern help in calculating target levels after a breakout.
The disadvantages of the Volatility Contraction Pattern:
- False breakouts can occur in a VCP price that may push through the pivot and then reverse, especially in choppy or low-activity conditions.
- By the time the Volatility Contraction Pattern confirms, much of the move may have already happened, which affects your risk-reward ratio.
- The Volatility Contraction Pattern often takes a long time to develop, especially on higher timeframes.
In Closing
In this article, we learned the Volatility Contraction Pattern, its structure, how to identify it, how to trade it, along with an example, its advantages, and disadvantages.
The Volatility Contraction Pattern is a powerful tool that signals the consolidation in the ongoing uptrend, indicating multiple opportunities for clear entry and exit signals.
Your profitability depends on your approach to the trade, your risk management, and your mindset when you are holding the trade, as no indicator or tool is 100% accurate in financial market across the world, and as the Volatility Contraction Pattern efficiency and accuracy increase rapidly when it is combined with additional indicators or tools (RSI, MACD, or others), and traders should backtest this pattern on various timeframes and instruments to better understand its strengths and limitations.
