
When you begin trading, you would want to avoid unnecessary risky trades. Then, learning chart patterns can help interpret price action and structure trades more efficiently, though they aren’t always easy to identify or trade. They also help you identify the potential reversal and continuation in the price chart. One among those is the Broadening Top Chart Patterns.
In this article, we will discuss the Broadening Top Chart Patterns, its structure, how to identify it, how to trade it with an example, its advantages, and disadvantages.
What is the Broadening Top Chart pattern
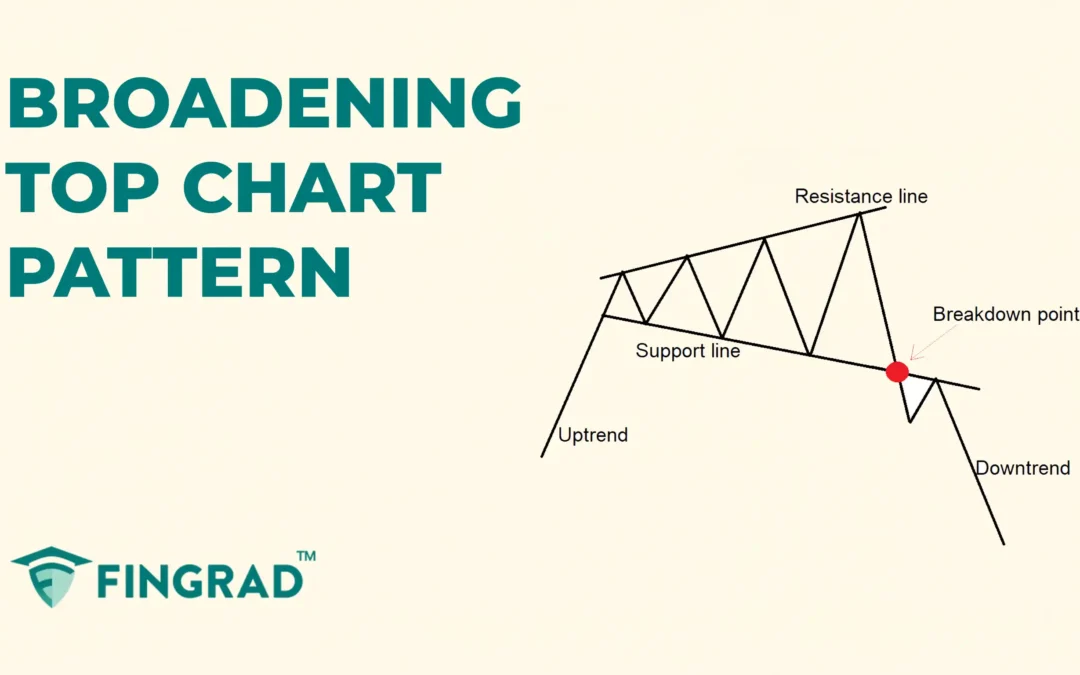
The Broadening Top Chart pattern is a consolidation pattern formed when the price moves within two diverging trendlines, followed by a strong bearish reversal. This pattern signals increasing volatility and indecision among buyers and sellers.
Once this consolidation of the price is over, the price typically breaks down to begin a strong bearish trend after the pattern is formed, and you can observe the increased volume on the selling side.
Two trendlines are drawn connecting the higher high and the lower lows, forming a widening triangle or inverted symmetrical triangle.
And as price swings become wider, it reflects a market that is losing direction and control, often leading to a sharp bearish movement.
Structure
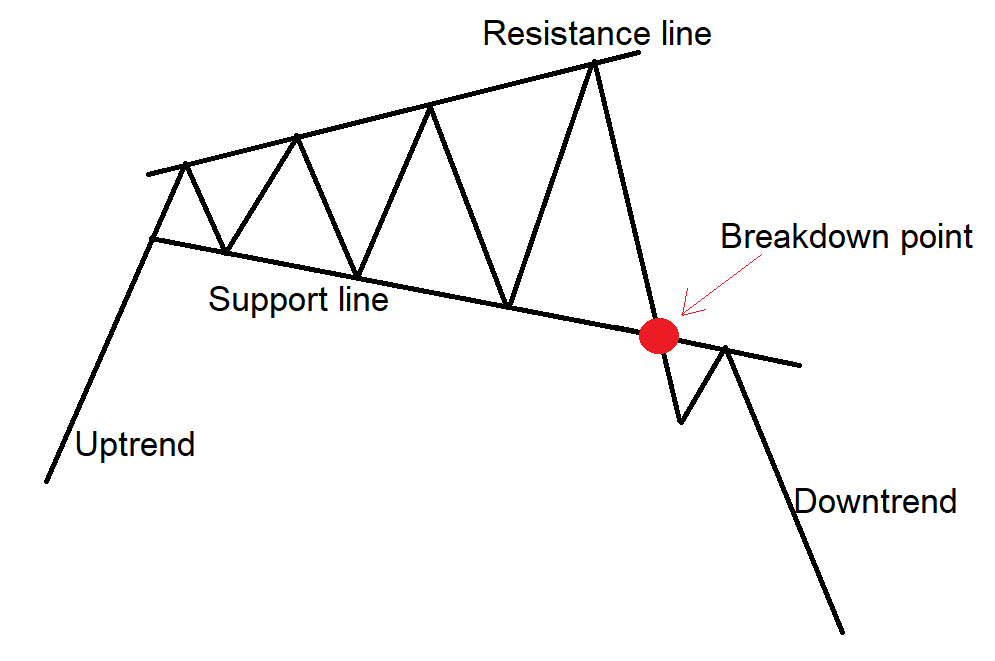
- Diverging Trendlines: On the price chart, two trendlines are drawn in an ongoing uptrend.
- Upper trendline: It is drawn by connecting a series of higher highs and acts as a strong resistance line.
- Lower trendline: It is drawn by connecting a series of lower lows and acts as a strong support line.
The price should touch each trendline at least two to three times to validate the pattern.
- Breakout Confirmation: The pattern breakdown is confirmed only when the bearish candle closes below the support line of the pattern.
How to identify the Broadening Top Chart Pattern?
Identify the security in an uptrend, and look for a series of price swings that get larger on both the upside and downside, then draw two trendlines connecting them, which diverge toward a point, forming an inverted symmetrical triangle.
During the pattern, volatility typically expands as swings widen; activity can vary and may rise into resolution.
Wait for a breakdown candlestick: The pattern is confirmed when the price closes below the support line, and the signal to trade the security in a downward direction.
How to trade the Brodening Top chart pattern?
Sell signal:
Entry:
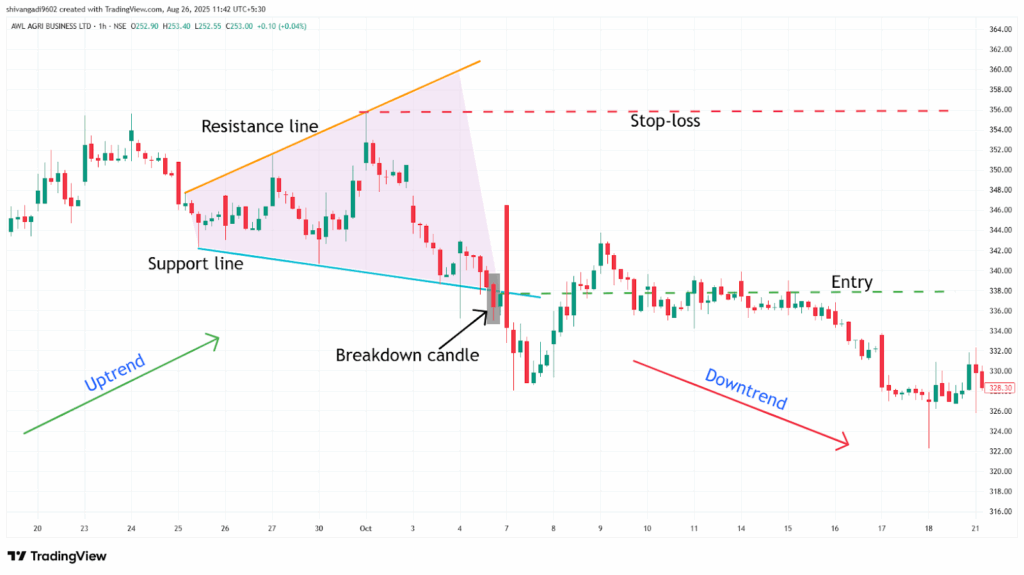
- Enter a short position when the candle closes below the lower trendline of the broadening top chart pattern.
Stop-loss:
- Place the stop-loss at the high of the most recent swing top within the inverted triangle.
Target:
- Measure the height of the Broadening Top at its widest point, project that distance from the breakdown point, and set the target.
Target Price = Breakdown Point – (Height of the Broadening Top)
- Or place your target according to your risk-reward ratio of 1:1, 1:2, or higher.
Example:
The chart below shows an example of “ AWL AGRI Business Ltd” stock at a 1-hour timeframe from 25th September to 4th October 2024, and you can see the sell signal generated by the Broadening Top Chart pattern.
What are the advantages of the Broadening Top Pattern?
- The Broadening Top is a recognized volatility-expansion pattern that can precede bearish reversals or continuations, with reliability dependent on context and confirmation.
- The trendline of the Broadening Top Pattern acts as a strong resistance after the breakdown of the pattern.
- The Broadening Top Pattern provides a clear entry, stop-loss, and target for everyone.
- The Broadening Top Pattern is versatile across all timeframes and all other security markets, as a single strategy can be applicable for all markets.
What are the disadvantages of the Broadening Top Pattern?
- False breakouts can happen in a Broadening Top Pattern when the price moves below the trendline with low volume and then it quickly reverses, especially during a sideways market.
- By the time the Broadening Top Pattern confirms, much of the move may have already happened.
- The Broadening Top Pattern often takes a long time to develop, especially on higher timeframes.
In Closing
In this article, we explored the Broadening Top Pattern, its structure, how to identify it, how to trade it, along with an example, its advantages, and disadvantages.
The Broadening Top Pattern is a powerful tool used to identify potential bearish continuation in the ongoing uptrend after a pullback, and it indicates multiple opportunities for clear entry and exit rules that are easy to follow.
Your profitability depends on your approach to the trade, your risk management, and your mindset when you are holding the trade, as no indicator or tool is 100% accurate, and when the Broadening Top Pattern is combined with additional indicators or tools (RSI, MACD, or others), its efficiency and accuracy increase rapidly.
