
In financial markets worldwide, chart patterns help traders analyse the price action, trend, and volatility of markets to identify trend reversals and continuation in an ongoing trend. Technical analysis enhances your understanding of the market and makes better entry and exit decisions by providing an advantage over the trade, as it defines the entry indication.
In this article, we will discuss the Impulse Wave Pattern, its structure, how to identify it, how to trade it with an example, its advantages, and its disadvantages.
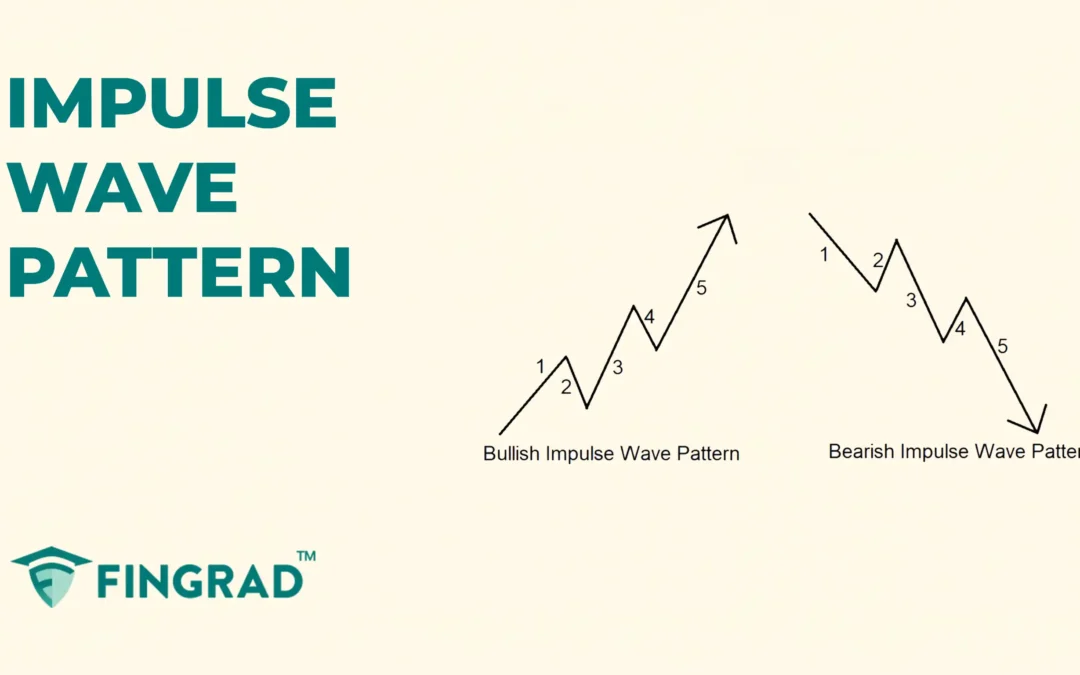
What is the Impulse Wave Pattern?
The Impulse Wave is part of Elliott Wave Theory, representing a five-wave move in the direction of the primary trend that occurs during strong bullish or bearish movements and is composed of three motive waves (1, 3, and 5) and two corrective waves (2 and 4).
The wave pattern reflects the price action, with corrections in between.
The term “Impulse” refers to the strong and quick movement in the direction of the main trend with a small pullback in between the price action.
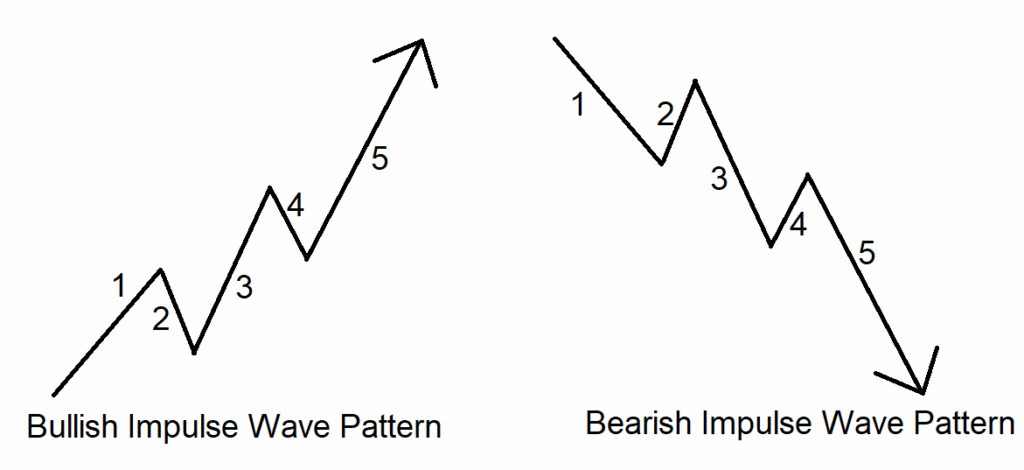
Structure:
For a bullish or bearish movement, the pattern is labelled as: 1→2→ 3→ 4→ 5
- Wave 1: It is the initial move in the direction of the trend.
- Wave 2: A corrective wave that does not retrace beyond the start of Wave 1; its depth varies and is often gauged with retracement tools rather than fixed percentages.
- Wave 3: After the pullback, the price moves strongly and is longer than the previous wave, driven by strong momentum.
- Wave 4: A corrective wave that does not overlap the price territory of Wave 1 in most impulse guidelines.
- Wave 5: After the pullback, it is a strong push in the direction of the trend.
How to identify the Impulse Wave Pattern?
Bullish Signal:
- Identify a security in an uptrend, then look for the price consolidation as the price forms higher highs and higher lows. Then look for the price to form a wave structure in an upward direction. Then, flat lines at the higher highs and lows to understand the price action and identify the resistance and support lines as the price corrects twice. Wait for the breakout candle to form.
- Plan to enter trades at the start of Wave 3 (after Wave 2 retracement) or Wave 5 (after Wave 4 retracement), often confirmed using Fibonacci retracement and momentum indicators, and the Impulse Wave pattern is confirmed.
Bearish Signal:
- Identify a security in a downtrend, then look for the price consolidation as the price forms lower highs and lower lows. Then, look for the price to form a wave structure in a downward direction. Then, flat lines at the lower highs and lows to understand the price action and identify the resistance and support lines as the price corrects twice. Wait for the breakdown candle to form.
- Plan to enter trades at the start of Wave 3 (after Wave 2 retracement) or Wave 5 (after Wave 4 retracement), often confirmed using Fibonacci retracement and momentum indicators, and the Impulse Wave pattern is confirmed.
How to trade the Impulse Wave pattern?
Buy signal:
Entry:
- Plan for a long position at the start of Wave 3 (after the Wave 2 correction) or the start of Wave 5 (after the Wave 4 pullback) with an increase in the buying volume.
Stop-loss:
- Place the stop-loss at the low of the most recent swing, according to your entry.
Target:
- Use common Elliott targets such as Fibonacci extensions (e.g., Wave 3 often targets 1.618× Wave 1; Wave 5 may target equality with Wave 1 or 0.618× Wave 1 beyond Wave 3).
- Or targets can be based on your risk-reward ratio, also.
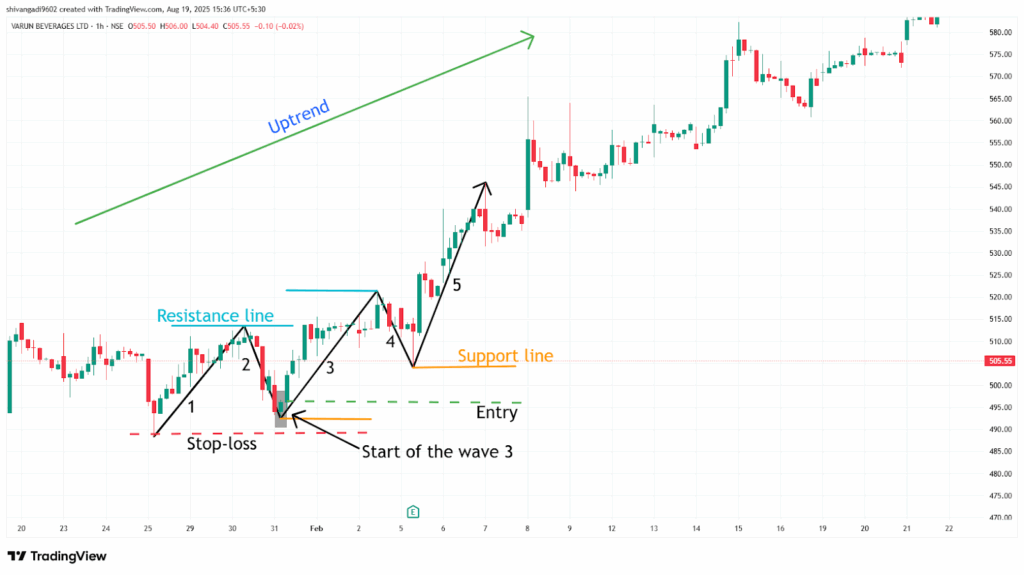
Example:
The chart below shows an example of “Varun Beverages Ltd” stock at a 1-hour timeframe from 5th January to 7th February 2024, and you can see the buy signal generated by the Impulse Wave pattern.
Sell signal:
Entry:
- Plan for a short position at the start of Wave 3 (after the Wave 2 correction) or the start of Wave 5 (after the Wave 4 pullback) with an increase in the selling volume.
Stop-loss:
- Place the stop-loss at the high of the most recent swing, according to your entry.
Target:
- Use extensions such as Wave 3 ≈ 1.618 × Wave 1 projected from the Wave 2 high; Wave 5 ≈ Wave 1 length projected from the Wave 4 high, subject to market context.
- Or, according to your preferred risk-reward ratio, depending on your trading strategy, set the target.
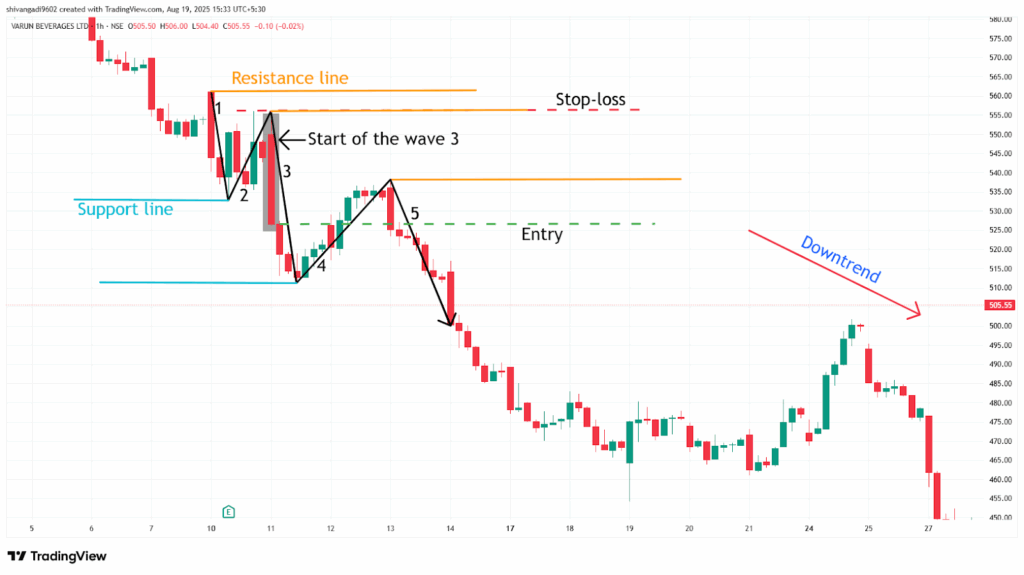
Example:
The chart below shows an example of “Ambuja Cements Ltd” stock at a 1-hour timeframe from 10th to 14th February 2025, and you can see the sell signal generated by the Impulse Wave pattern.
What are the advantages of the Impulse Wave pattern?
- The impulse framework can help contextualize trending moves in both directions, but its reliability depends on accurate wave counts and market conditions.
- The trendline of the Impulse Wave pattern acts as a strong support after the breakout and a strong resistance after the breakdown of the pattern.
- The Impulse Wave pattern provides a clear entry, stop-loss, and target for everyone.
- The Impulse Wave pattern is versatile across all timeframes and all other security markets, as a single strategy can be applicable for all markets.
What are the disadvantages of the Impulse Wave pattern?
- As volatility increases during the Impulse Wave pattern formation, it can lead to frequent price swings and false signals, making it hard to trade for beginners.
- The Impulse Wave pattern often takes a long time to develop, especially on higher timeframes.
- False breaks can occur regardless of volume, and invalidation comes from violating impulse rules (e.g., Wave 4 overlapping Wave 1 in many cases), not from a trendline alone.
In Closing
In this article, we learned the Impulse Wave pattern, its structure, how to identify it, how to trade it, along with an example, its advantages, and disadvantages.
The Impulse Wave pattern is a powerful tool used to identify potential continuation of the ongoing trend after a consolidation, and it indicates multiple opportunities for clear entry and exit rules that are easy to follow.
Your profitability depends on your approach to the trade, your risk management, and your mindset when you are holding the trade, as no indicator or tool is 100% accurate, and when the Impulse Wave pattern is combined with additional indicators or tools (RSI, MACD, or others), its efficiency and accuracy increase rapidly.
