
For new traders seeking to understand trend dynamics, learning chart patterns can help highlight potential reversals and continuations, though they are not always easy to spot and never guarantee minimal risk. The Pennant Chart Pattern is an important tool to start with for beginners.
In this article, we will understand the Pennant Chart Pattern, its structure, how to identify it, how to trade it with an example, its advantages, and disadvantages.
What is the Pennant Chart Pattern?
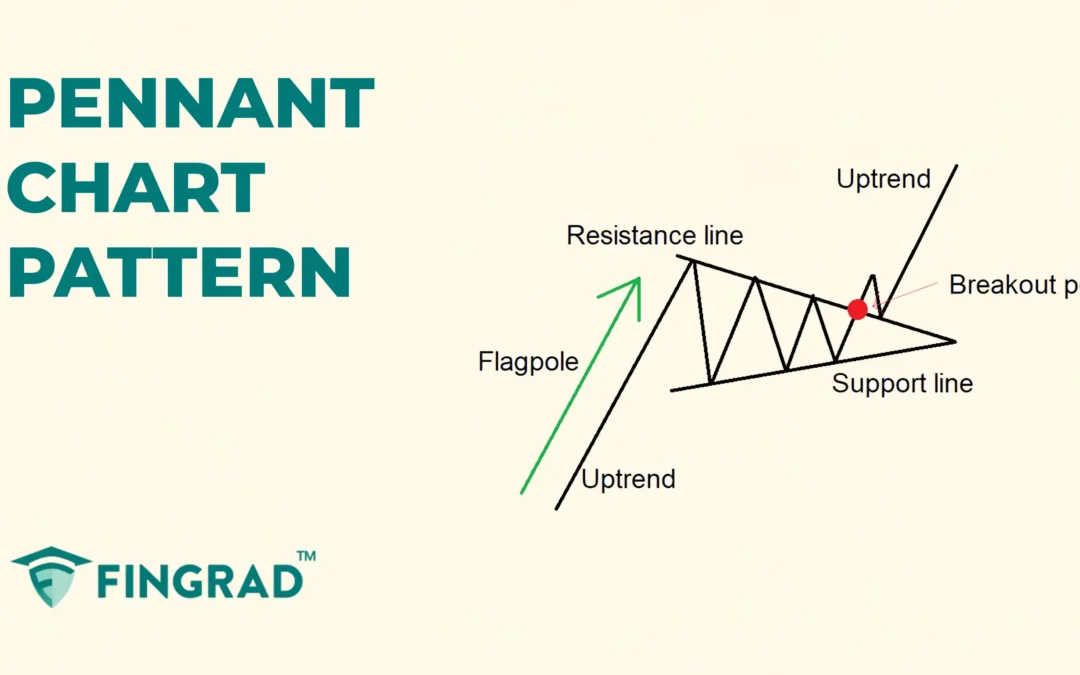
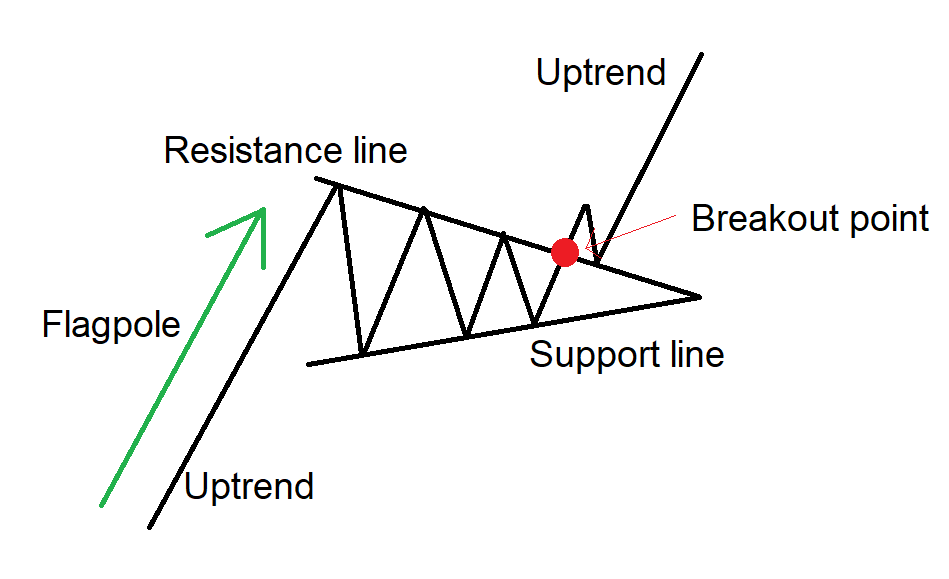
The Pennant Chart Pattern is a continuation pattern formed when the price moves within two trendlines, followed by a breakout or breakdown, depending on the ongoing trend. The price then consolidates in a small symmetrical triangle, known as a pennant, which resembles a small flag on a pole.
The Pennant Chart Pattern can form over days, weeks, or even months, depending on the price action.
The term “Pennant” refers to a small triangular flag shape of the price consolidation, and the upper trendline acts as a strong resistance line, and the lower trendline acts as a strong support line
Structure
The Pennant pattern is formed in the middle of the trend, and it consists of two parts.
- Flagpole: It is the initial sharp price movement according to the trend.
- Pennant: The price is traded between the two converging trendlines leading to the formation of the pennant.
- Trend continuation: After the consolidation is over, the price breaks out or breaks down according to the trend and signals the continuation of the ongoing trend.
How to identify the Pennant chart pattern?
Bullish continuation:
Identify the security in an uptrend, wait for the price to consolidate, and then draw two trendlines connecting the lower highs and higher lows, which converge toward the end, forming a symmetrical triangle.
As price consolidates, trading volume typically decreases, indicating indecision in price action and reduced volatility.
Wait for a breakout candlestick: The pattern is confirmed when the price closes above the resistance line, and the signal to trade the security in an upward direction.
Bearish continuation:
Identify the security in a downtrend, and wait for the price to consolidate, as the price forms lower highs and higher lows, draw two trendlines connecting them, which converge toward a point, forming a triangle.
As price consolidates, the trading volume declines, signalling uncertainty in price action and reduced volatility of the security.
Wait for a breakout candlestick: The pattern breakdown is confirmed when the candle closes below the support line, and the signal to trade the security in a downward direction.
How to trade the Pennant chart pattern?
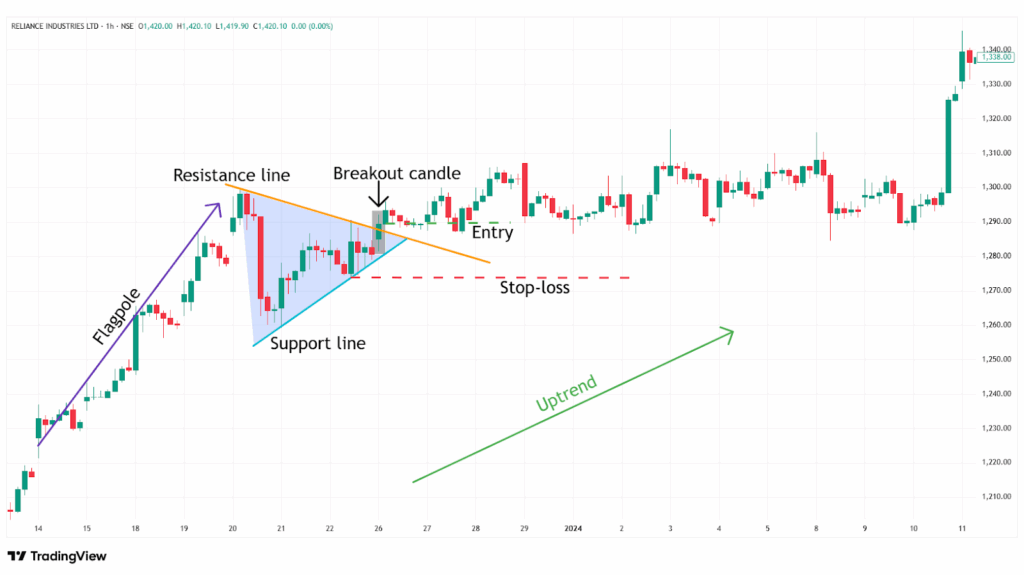
Buy Signal:
Entry:
- When the candle closes above the upper trendline with a higher volume, plan an entry for a long position.
Stop-loss:
- Place the stop-loss at the low of the most recent swing low within the pattern.
Target:
- Set the target, measure the height of the pattern at its widest point, and project that distance from the breakout point.
Target Price = Breakout Point + (Height of the pattern)
- Or set your target according to your risk-reward ratio for your trading strategy
Example:
In the image below, you can look at the chart of “RIL Ltd” stock at a 1-hour timeframe from 14th to 28th December 2023, and you can see the buy signal generated by the Pennant Chart Pattern.
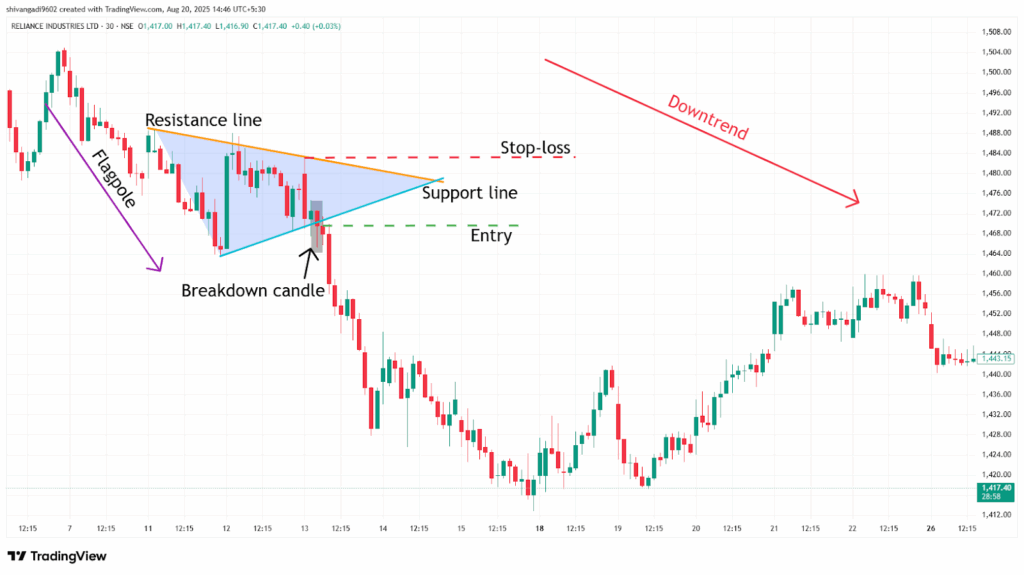
Sell Signal:
Entry:
- Enter a short position in the security when the candle breaks and closes below the lower trendline of the bearish pennant pattern formed.
Stop-loss:
- Place the stop above the pennant’s upper boundary or above the retest or swing high.
Target:
- Measure the height of the pattern at its widest point, project that distance downward from the breakdown point, and place the target.
Target Price = Breakdown Point – (Height of the pattern)
- Or set your target according to your risk-reward ratio for your trading strategy
Example:
In the image below, you can look at the chart of “ RIL Ltd” stock at a 30-minute timeframe from 6th to 13th March 2024, as the sell signal generated by the Pennant Chart Pattern.
What are the advantages of the Pennant Chart pattern?
- The Pennant Chart pattern is versatile and implemented across all timeframes and markets.
- The Pennant Chart pattern displays a clear understanding of the price action and provides optimal entry, stop-loss, and target levels.
- The Pennant Chart pattern acts as a strong resistance level after the breakdown of the pattern and a strong support level after the breakout.
- While trading the Pennant Chart pattern, the depth of the pattern helps in calculating target levels after a breakout.
The disadvantages of the Pennant Chart pattern:
- A false signal can occur in a Pennant Chart, and the price can quickly reverse again, especially in low-volume or sideways market conditions.
- The Pennant Chart pattern often takes a long time to develop, especially on higher timeframes.
- By the time the Pennant Chart pattern confirms, much of the move may have already happened, which affects your risk-reward ratio.
In Closing
In this article, we learned the Pennant Chart pattern, its structure, how to identify it, how to trade it, along with an example, its advantages, and disadvantages.
The Pennant Chart pattern is primarily a continuation setup that can help plan entries and exits when combined with confirmation and risk controls.
Your profitability depends on your approach to the trade, your risk management, and your mindset when you are holding the trade, as no indicator or tool is 100% accurate in financial market across the world, and as the Pennant Chart pattern’s efficiency and accuracy increase rapidly when it is combined with additional indicators or tools (RSI, MACD, or others), and traders should backtest this pattern on various timeframes and instruments to better understand its strengths and limitations.
