For new traders looking to understand trend shifts, learning chart patterns can help highlight potential reversals and continuations, though they aren’t always easy to spot and never guarantee minimal risk. Then, the Parabolic Curve pattern is an important tool to identify the bearish reversal patterns and provides an early entry to trade.
In this article, we will discuss the Parabolic Curve Pattern, its structure, how to identify it, how to trade it, provide an example of a trade scenario, and outline its advantages and disadvantages.
What is the Parabolic Curve Pattern
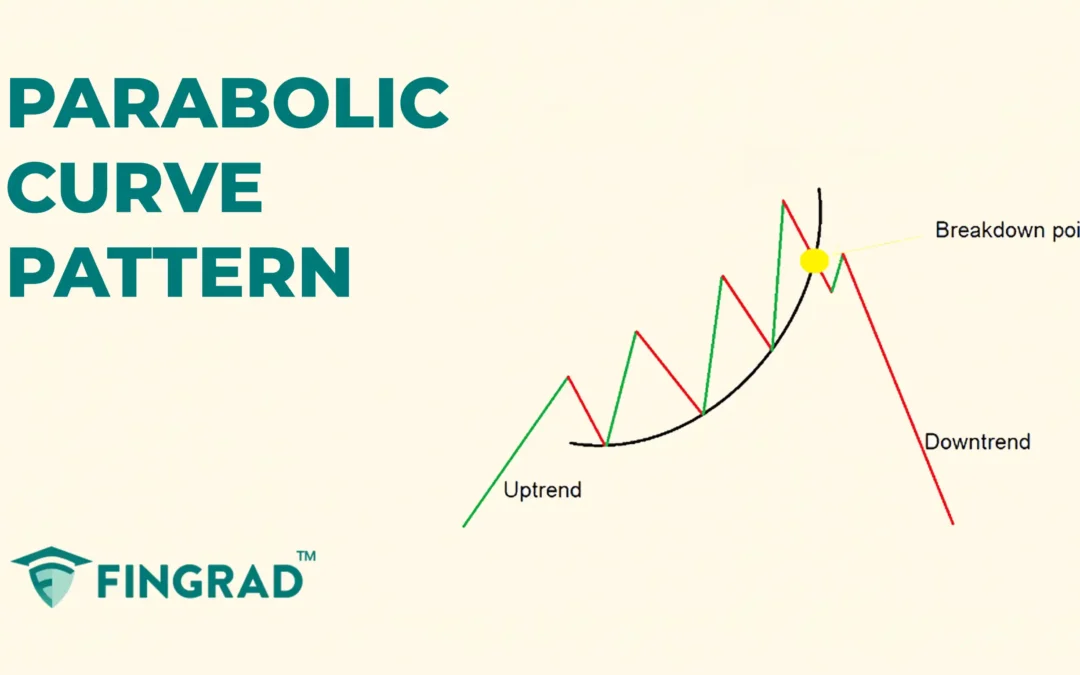
A Parabolic Curve Pattern indicates the potential bearish reversal in an ongoing uptrend and provides an entry signal in the reversal. The price of the security moves in a curved upward direction, forming a parabola-like shape on the chart.
This pattern displays the increasing strength of buyers and continuation of the ongoing trend over time, later leading to a sharp fall in price that becomes unstable.
Structure
- Continuation of the ongoing trend: The price starts with a slow and steady upward trend, forming the early part of the parabola with moderate volume in the security.
Later, the price action follows in a curved shape with an increased volume in the security.
- Breakdown: After a sharp upward move, a bearish candle forms below the curve’s support line, indicating panic-driven selling, indicating panic-driven selling.

How to identify the Parabolic Curve pattern
Identify the security trading in an uptrend where the price moves in slow and steady increases in volume. Then draw a parabolic curve below by connecting the price with the higher lows of the security.
Wait for the breakdown candle, when the strong bearish candle closes below the Parabolic Curve Pattern, plan the short position on the following candles.
How to trade the Parabolic Curve Pattern
Sell Signal:
Entry:
- Enter a short position at the close of the candle that closes below the curve formed.
Stop-loss:
- The stop loss for the trade can be placed above the recent swing high from the breakout.
Target:
- Set the target to the next support line.
- Or set your target according to your risk-reward ratio for your trading strategy
Example:
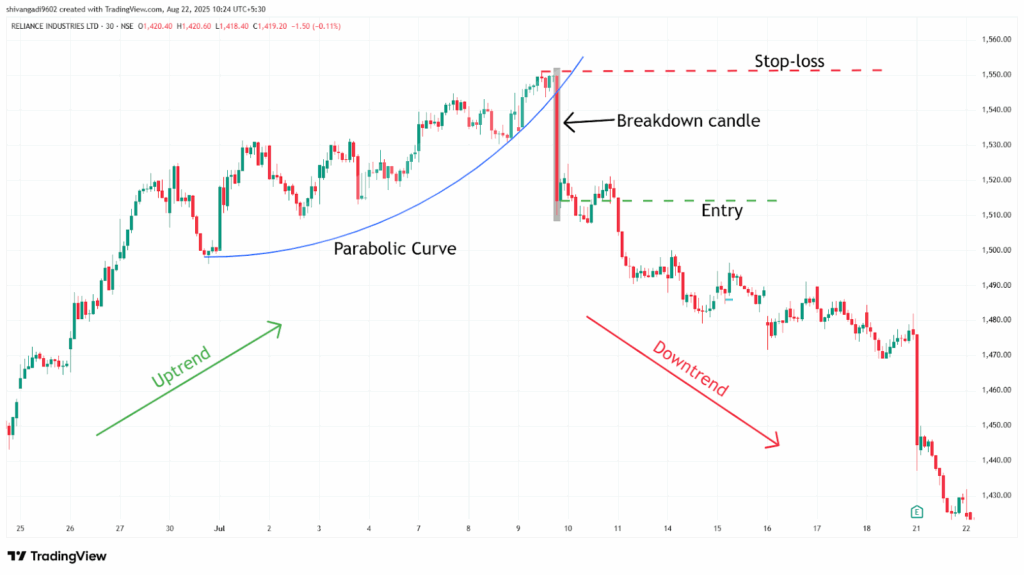
In the image below, you can look at the chart of “RIL Ltd” stock at a 30-minute timeframe from 30th June to 9th July 2024, and you can see the sell signal generated by the Parabolic Curve Pattern.

What are the advantages of the Parabolic Curve pattern
- The Parabolic Curve pattern is versatile and implemented across all timeframes and markets.
- The Parabolic Curve pattern displays a clear understanding of the price action and provides optimal entry, stop-loss, and target levels.
- The Parabolic Curve acts as a strong resistance level after the breakdown of the pattern.
- While trading the Parabolic Curve pattern, the height of the pattern helps in calculating target levels after a breakout.
The disadvantages of the Parabolic Curve pattern
- A false signal can occur in a Parabolic Curve, and the price can quickly reverse again, especially in low-volume or sideways market conditions.
- The Parabolic Curve pattern often takes a long time to develop, especially on higher timeframes.
- The Parabolic Curve pattern is difficult to trade for beginners, as it involves high risk during the trade.
In Closing
In this article, we learned the Parabolic Curve pattern, its structure, how to identify it, how to trade it, along with an example, its advantages, and disadvantages.
The Parabolic Curve pattern is a powerful tool that signals the potential reversal in the ongoing trend, indicating multiple opportunities for clear entry and exit signals.
Your profitability depends on your approach to the trade, your risk management, and your mindset when you are holding the trade, as no indicator or tool is 100% accurate in financial market across the world, and as the Parabolic Curve pattern’s efficiency and accuracy increase rapidly when it is combined with additional indicators or tools (RSI, MACD, or others), and traders should backtest this pattern on various timeframes and instruments to better understand its strengths and limitations.


