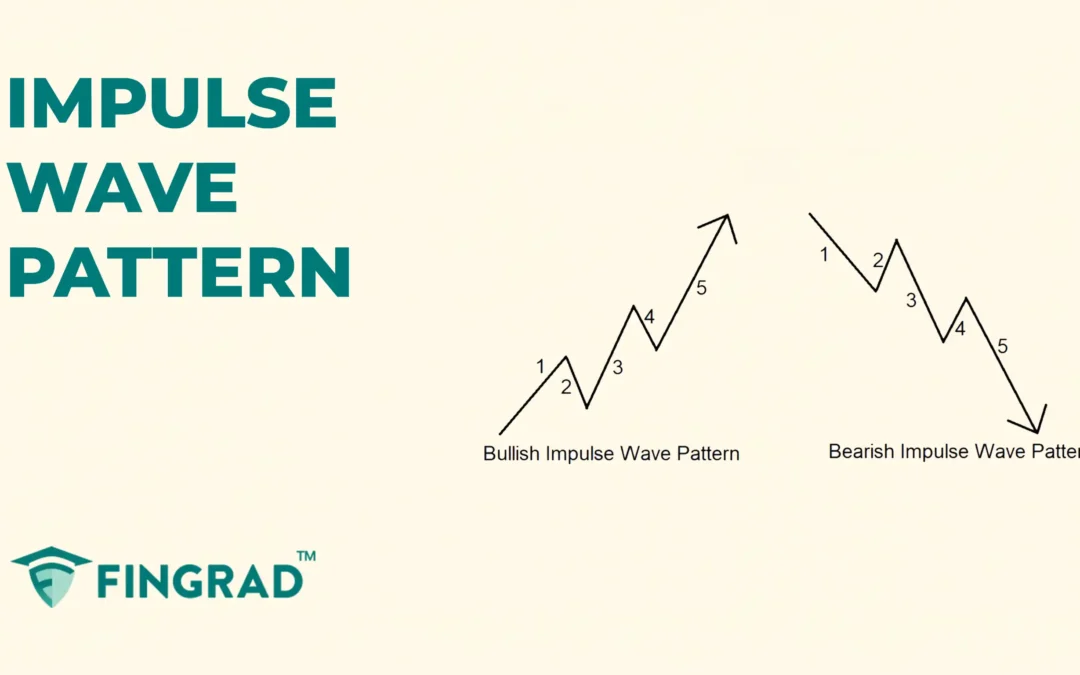
by FinGrad | Sep 16, 2025 | Technical Analysis
In financial markets worldwide, chart patterns help traders analyse the price action, trend, and volatility of markets to identify trend reversals and continuation in an ongoing trend. Technical analysis enhances your understanding of the market and makes better entry...
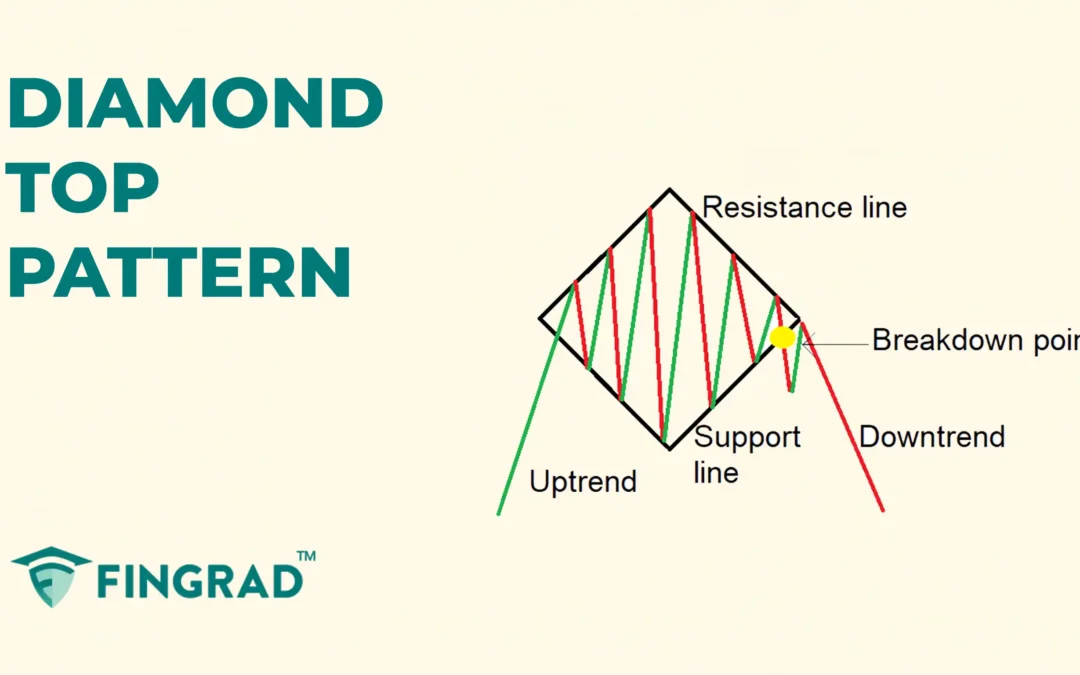
by FinGrad | Sep 16, 2025 | Technical Analysis
In Technical analysis, there are chart patterns that are rare to spot, and when spotted, they give a strong directional movement according to the type of the pattern, and one such pattern is the Diamond Top pattern. It is a chart pattern associated with potential...
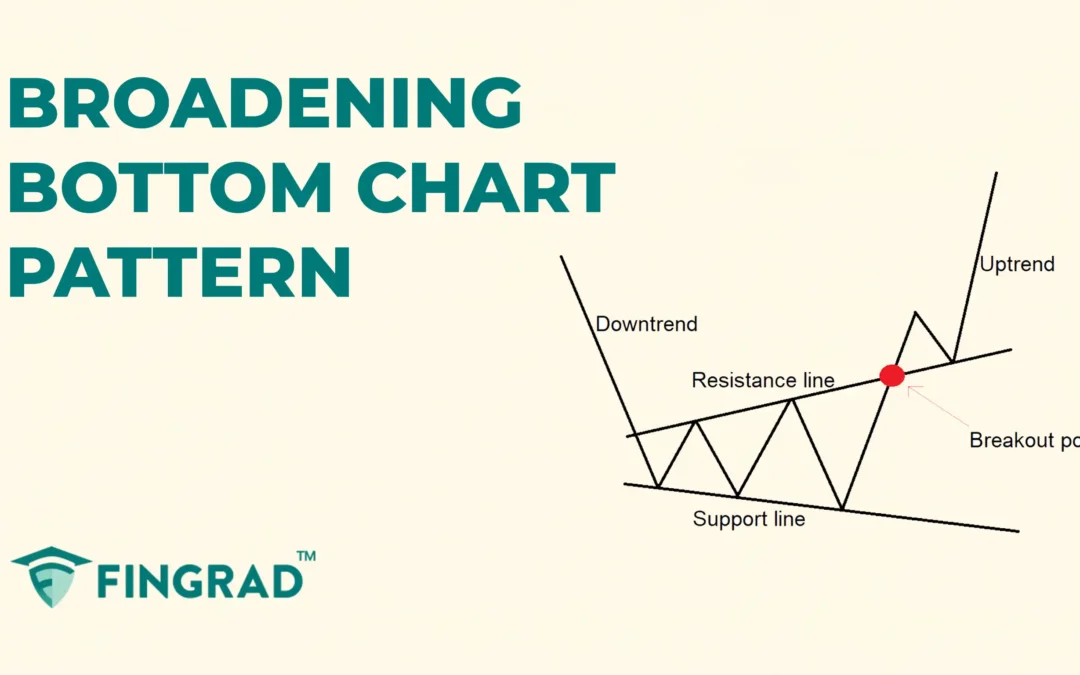
by FinGrad | Sep 15, 2025 | Technical Analysis
When trading with technical analysis, learning chart patterns can help interpret price action and structure trades more efficiently, though they aren’t always easy to identify or trade. They also help you identify the potential reversal and continuation in the price...
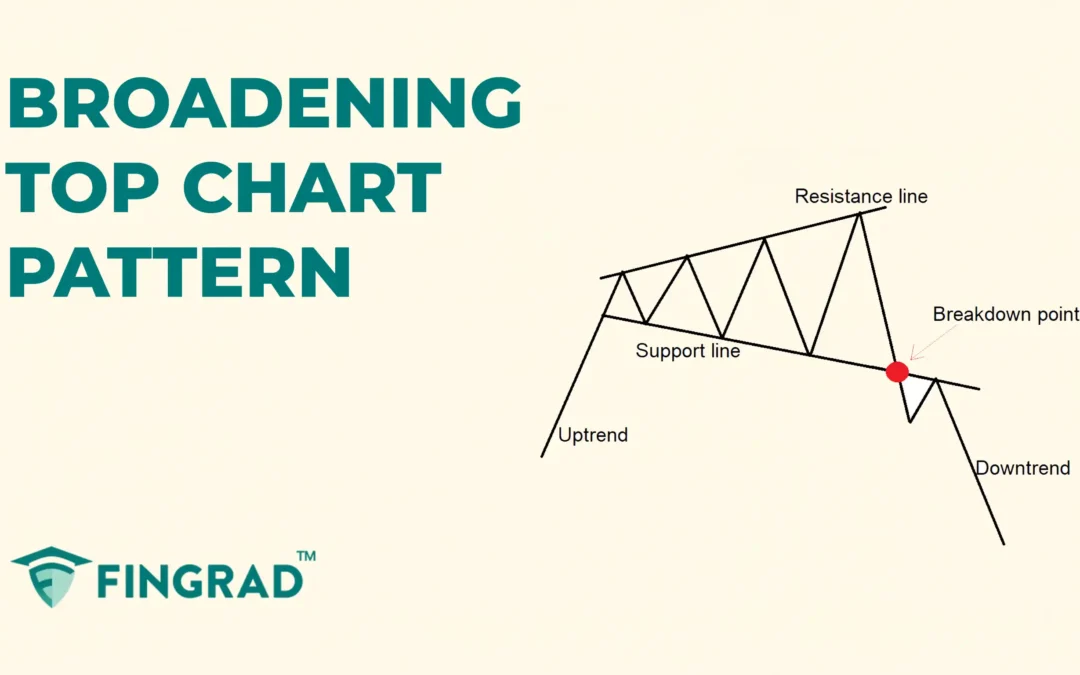
by FinGrad | Sep 15, 2025 | Technical Analysis
When you begin trading, you would want to avoid unnecessary risky trades. Then, learning chart patterns can help interpret price action and structure trades more efficiently, though they aren’t always easy to identify or trade. They also help you identify the...
by FinGrad | Sep 14, 2025 | Technical Analysis
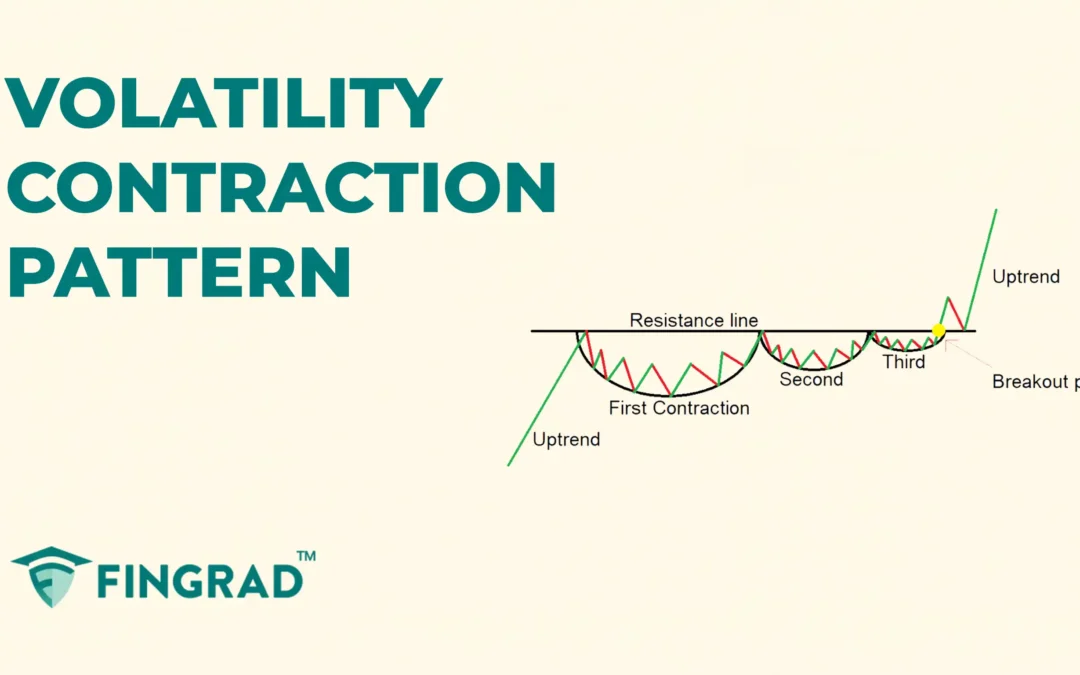
Technical analysis involves trading with tools and indicators, which are powerful and reliable during your trades. One such pattern is the Volatility Contraction Pattern (VCP), which highlights tightening consolidations and can help plan entries and risk, though it is...

