by FinGrad | Sep 11, 2025 | Technical Analysis
In technical analysis, chart patterns are a visual representation of price action, displaying the strength of buyers and sellers in the market or security. Chart patterns can help flag potential future moves based on past price action, but they are not always easy to...
by FinGrad | Sep 10, 2025 | Technical Analysis
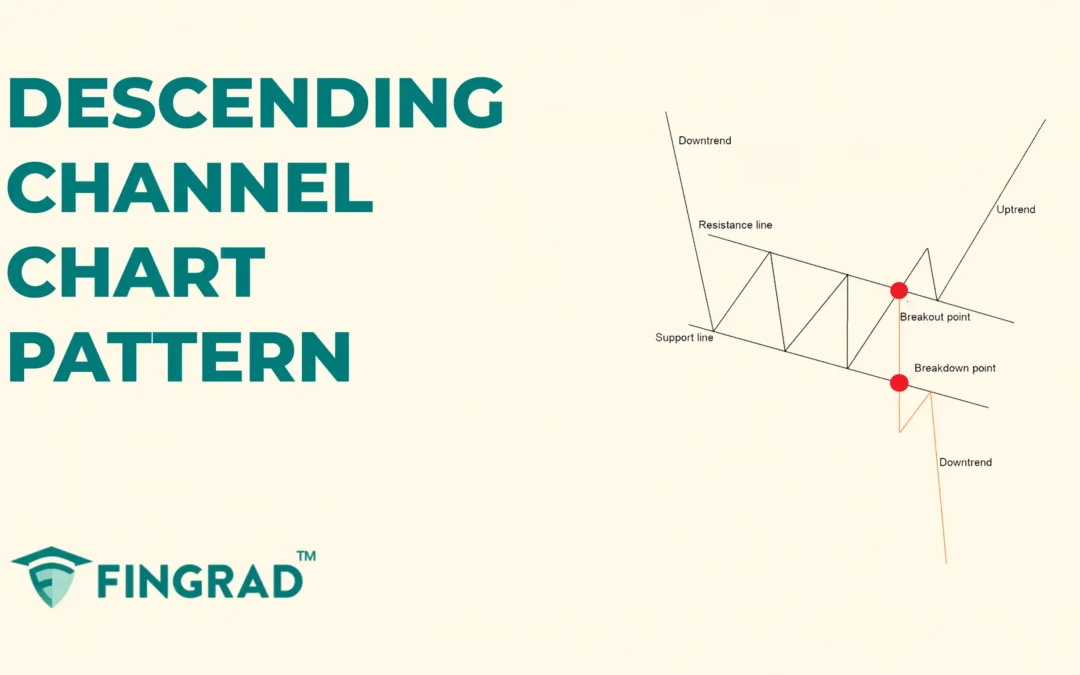
When trading price action-based using technical analysis, you may have encountered a chart pattern during the price action’s consolidation phase. Some chart patterns can help highlight potential continuations or reversals, but they’re not always easy to spot,...
by FinGrad | Sep 10, 2025 | Technical Analysis
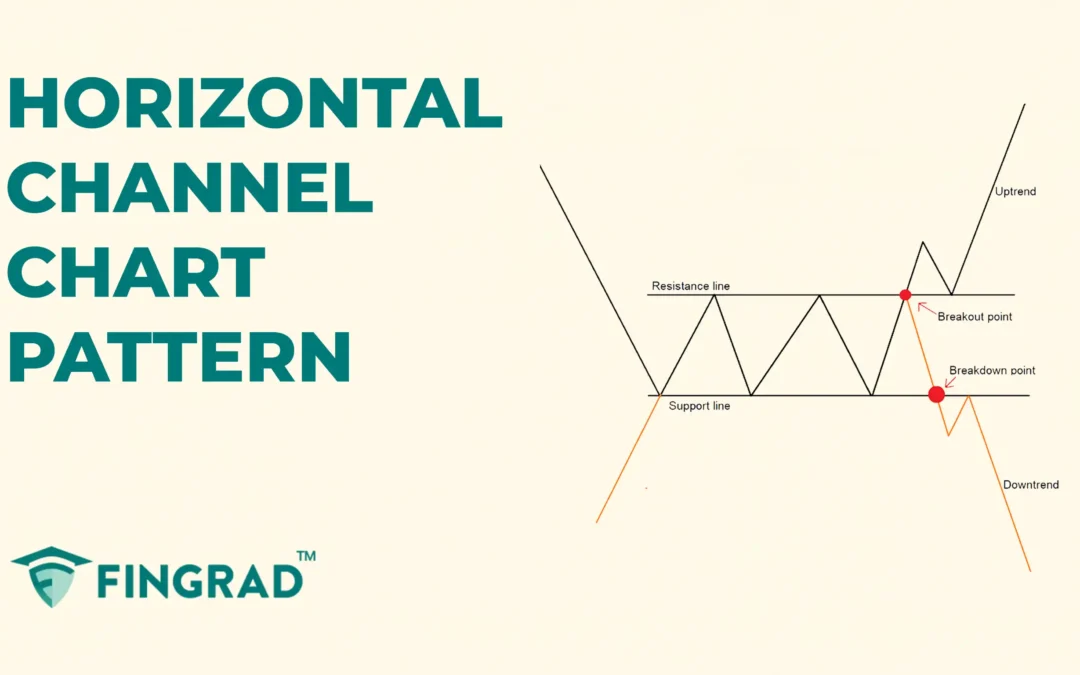
When your trading is based on technical analysis, then you might come across the chart pattern as they are visual representations of price movements reflecting the battle between buyers and sellers, as they are used by traders to predict future price direction, either...
by FinGrad | Sep 9, 2025 | Technical Analysis
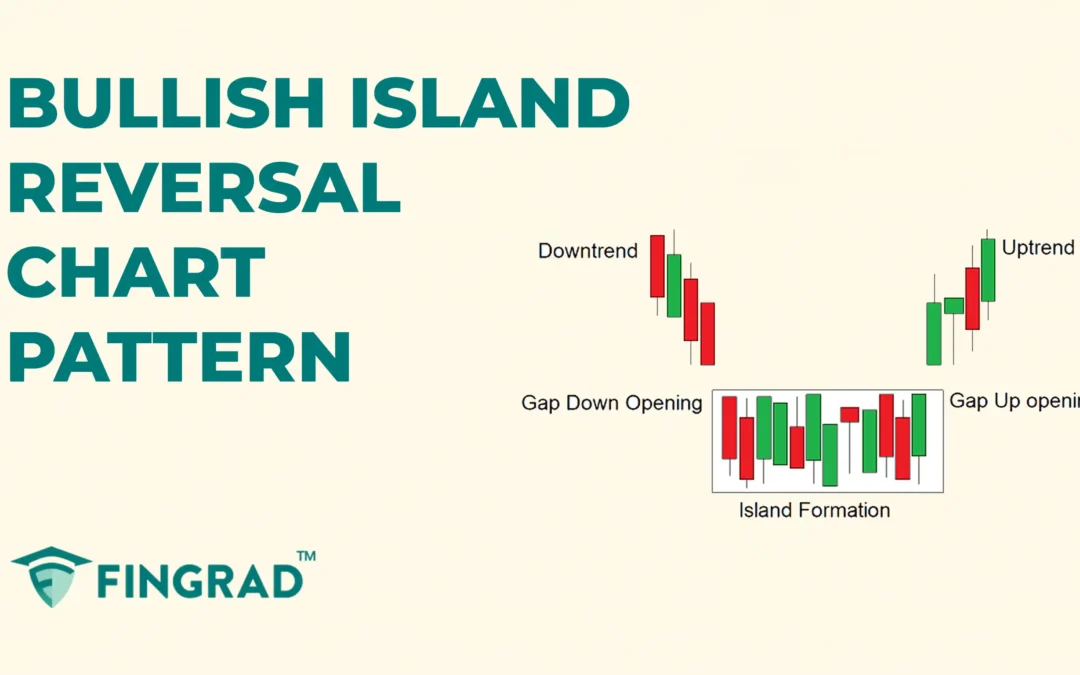
When you begin trading, you would want to avoid unnecessary risk and trade efficiently. Therefore, one must start learning the chart patterns, as they are easy to identify and trade with a better understanding of price action, allowing you to build a profitable...
by FinGrad | Sep 9, 2025 | Technical Analysis
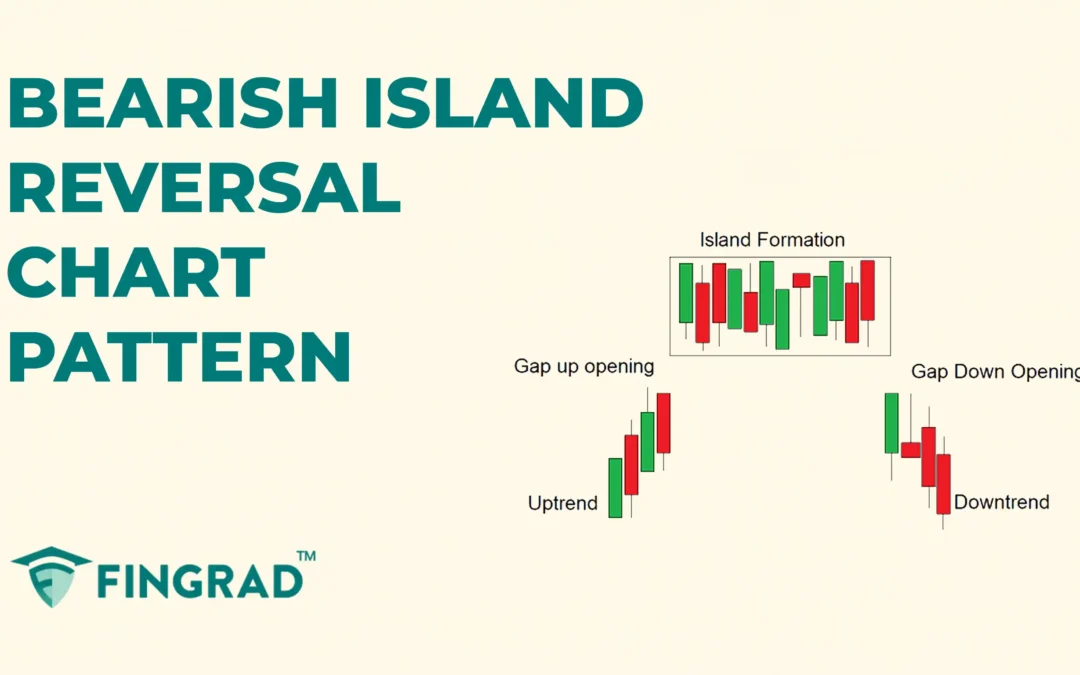
In trading, technical analysis is widely used to study price movements and identify patterns that reveal market behaviour. These patterns help traders anticipate whether a trend will continue or reverse, giving them an edge in planning entries and exits. One such...

