
In technical analysis, chart patterns are a visual representation of price action, displaying the strength of buyers and sellers in the market or security. Chart patterns can help flag potential future moves based on past price action, but they are not always easy to identify and never guarantee direction.
In this article, we will understand the Bearish Island Reversal chart pattern, its structure, how to identify it, how to trade it with an example, its advantages, and disadvantages.
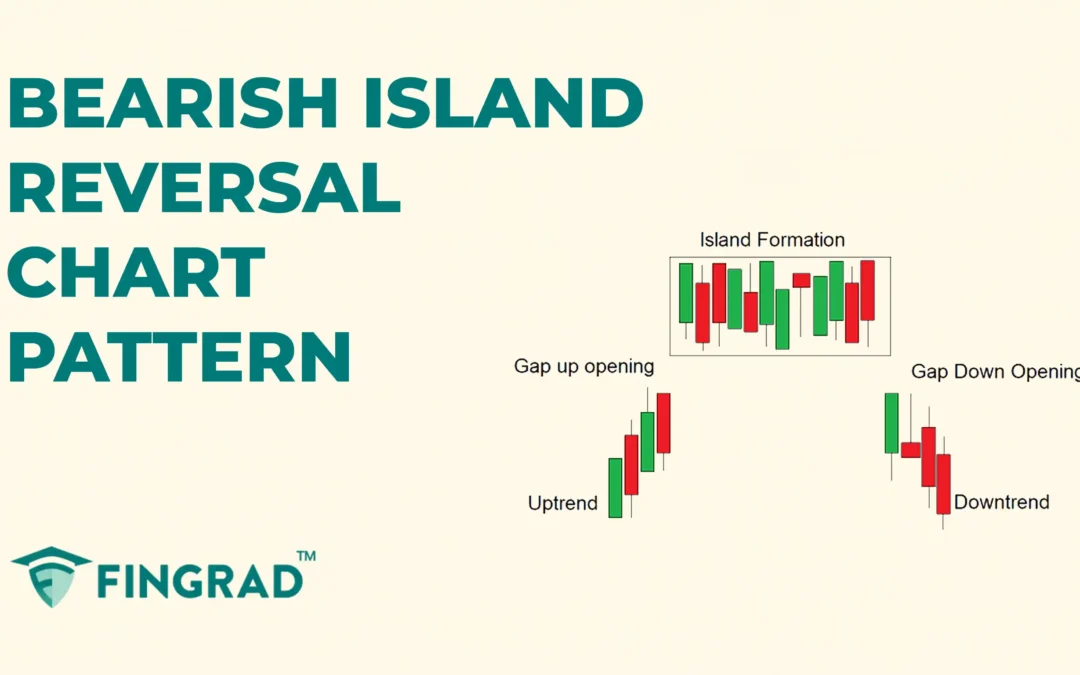
The Bearish Island Reversal chart pattern
The Bearish Island Reversal is one of the rare and efficient chart patterns that forms when a group of candles becomes “isolated” from the previous price action by gaps on both sides, indicating a shift from bullish to bearish sentiment.
The pattern involves a gap-up at the beginning of its formation, followed by a gap-down after the pattern is formed.
The term “island” refers to the candle formation as the pattern signals a temporary pause in an ongoing uptrend, followed by a strong selling interest creating a gap-down opening.
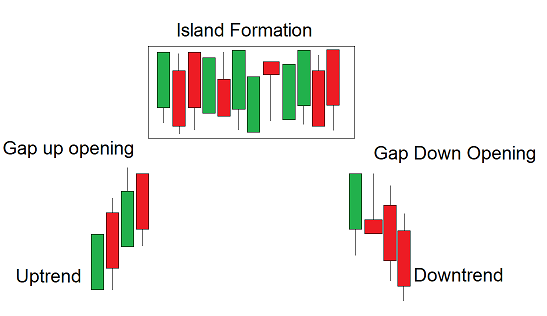
Structure
- Gap Up: The security is trading in an uptrend, the first candle opens higher than the previous day’s close, leaving a blank space or “gap” on the chart, which displays buyers’ strength and their interest in pushing the price up, indicating a strong uptrend ahead.
- Island Formation: The candle trades within a narrow price range with low volume, displaying indecision and a lack of clear trend direction.
- Gap Down and Reversal Signal: The following candle opens lower than the previous day’s close, leaving a blank space or “gap” on the chart, which is a gap-down opening, and the gap-down between the candles indicates seller strength and confirms the bearish reversal.
How to Identify the Bearish Island Reversal Pattern
Identify a security trading in an uptrend and with a gap-up opening from the previous day’s close, and wait for the candle to trade within a small price range.
After the consolidation, spot a gap-down opening immediately after the previous day’s close, followed by confirming that volume spikes indicate strong participation. Wait for the confirmation as the follow-through selling and lower closes after the gap down.
How to trade the Bearish Island Reversal chart pattern
Sell Signal:
Entry:
- Enter a short position as the candle closes below the gap-down level, confirming the breakdown from the island.
Stop-loss:
- Place the stop loss at the high of the consolidation range and trade with smaller quantities initially, and later add on.
Target:
- Place the target by measuring the height of the island and adding that height to the breakdown level.
Target Price = Gap-Down Breakout Level – Height of the Island
- Or at your preferred risk-reward ratio, such as 1:1, 1:2, or higher, set your target.
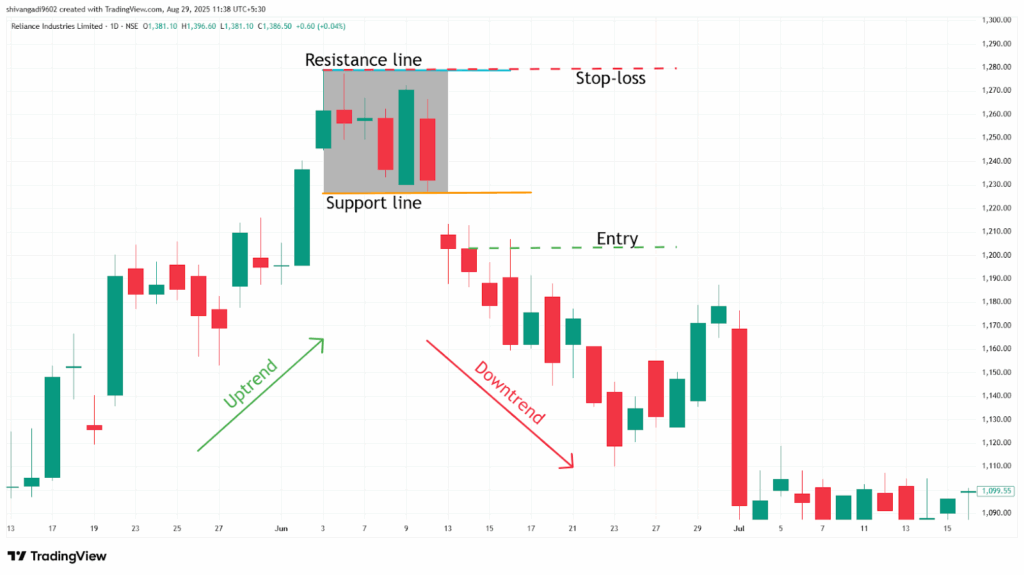
Example:
The chart below shows an example of “RIL Ltd” stock at a 1-day timeframe from 3rd to 10th June 2022. As you can see, the sell signal was generated by the Bearish Island Reversal chart pattern.
The advantages of the Bearish Island Reversal chart pattern
- The Bearish Island Reversal pattern provides a clear understanding of the price action and indicates clear entry, stop-loss, and target for everyone.
- The Bearish Island Reversal is versatile across all timeframes and all other stock markets, as a single strategy, can be applicable for all markets.
- The Bearish Island Reversal pattern acts as a strong resistance level after the breakdown of the pattern.
- When trading the Bearish Island Reversal, the island height can guide downside targets after a breakdown.
The disadvantages of the Bearish Island Reversal chart pattern
- False breakdown can occur in a Bearish Island Reversal when, after the gap-down, the price retraces briefly on low volume before quickly reversing again, especially in low-volume or sideways market conditions.
- By the time the Bearish Island Reversal confirms, much of the move may have already happened.
- The Bearish Island Reversal often takes a long time to develop, especially on higher timeframes.
In Closing
In this article, we learned the Bearish Island Reversal chart pattern, its structure, how to identify it, how to trade it, along with an example, its advantages, and disadvantages.
The Bearish Island Reversal chart pattern is a powerful tool that signals potential reversals in the ongoing uptrend, indicating multiple opportunities for clear entry and exit signals.
Your profitability depends on your approach to the trade, your risk management, and your mindset when you are holding the trade, as no indicator or tool is 100% accurate, and as the Bearish Island Reversal chart pattern’s efficiency and accuracy increase rapidly when it is combined with additional indicators or tools (RSI, MACD, or others).
