
In trading, technical analysis is one of the most effective ways to understand market behaviour by studying price movements and chart patterns. Among these patterns, candlestick formations play a key role as they reflect market sentiment and help traders anticipate future price action. One such pattern is the Bearish Thrusting candlestick pattern, which signals a potential trend reversal.
In this article, we will be exploring the Bearish Thrusting candlestick pattern, its structure, the psychological pattern of candlesticks, how to trade the pattern with an example, and its advantages and disadvantages.
What is the Bearish Thrusting candlestick pattern
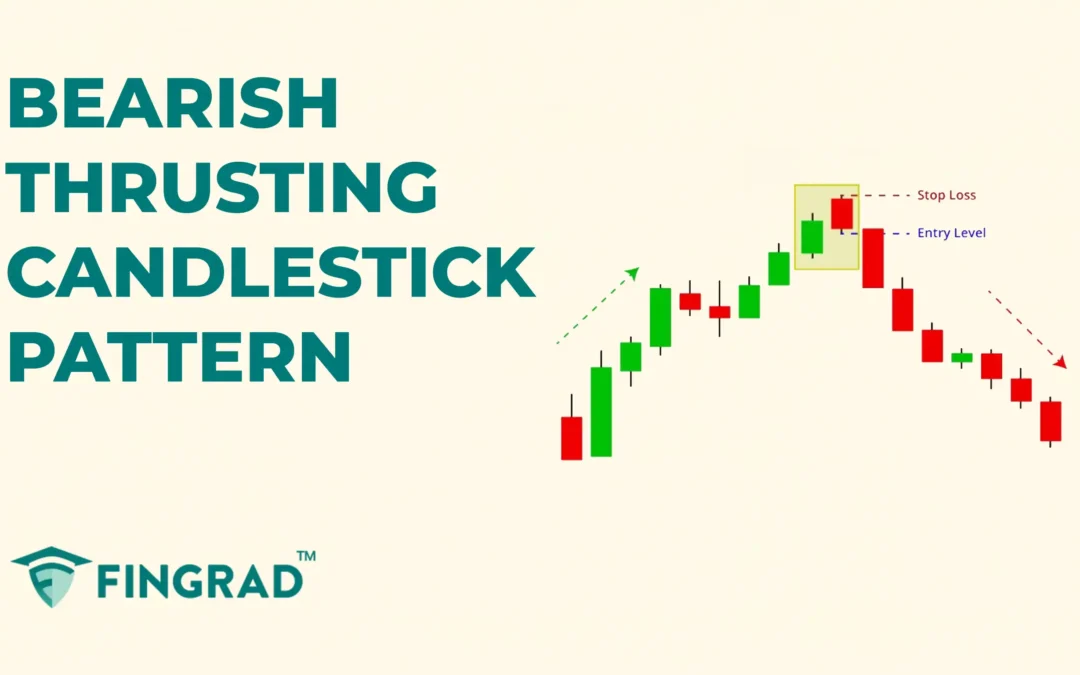
The Bearish Thrusting candlesticks pattern is a two-candle formation indicating a bullish reversal in a downtrend.
The term “Thrusting” refers to the bearish candlestick pushing into a previous bullish candlestick’s body, but failing to close above its midpoint.
Structure of Bearish Thrusting Pattern
The Bearish Thrusting candlestick is spotted in the middle of the current uptrend.
- First candlestick: A long bullish candlestick is formed, displaying the buyer’s step into changing the movement from bearish to bullish.
- Second candlestick: A long bearish candlestick is formed, opens with a slight gap up, and closes near the midpoint of the first candlestick, displaying the strength of sellers towards a downtrend.
Psychology Pattern behind the Bearish Thrusting candlestick
- Bullish Candlestick: The security is in an uptrend, and a strong bullish candlestick is formed, indicating the buyers are getting stronger.
- Bearish candlestick: The second candlestick opens with a gap up from the first, but sellers quickly take control, pushing the price down. Although buyers attempt to reject the lows, the candle closes near the midpoint of the first candlestick, forming a bearish pattern.
This suggests that the trend will change to a downtrend in the upcoming trading sessions, with buyers gradually losing control over the market.
How to trade a Bearish Thrusting candlestick pattern
The Bearish Thrusting candlestick is versatile across all frames.
After spotting the Bearish Thrusting candlestick formation, plan for a short position entry after the confirmation.
Entry:
- After the closing of the second candlestick, you can plan to enter a short trade in the security at the open of the following bearish candlestick.
Stop-loss:
- An ideal stop-loss is at the high of the bearish thrusting candlestick formed.
Target:
- The primary target is the next support line, or you can set the target for the trade according to your risk-reward ratio.
- If you spot any candlestick pattern formed signalling a bullish reversal, after the confirmation candlestick, plan to book partial profits or trail the stop-loss.
Example scenario:
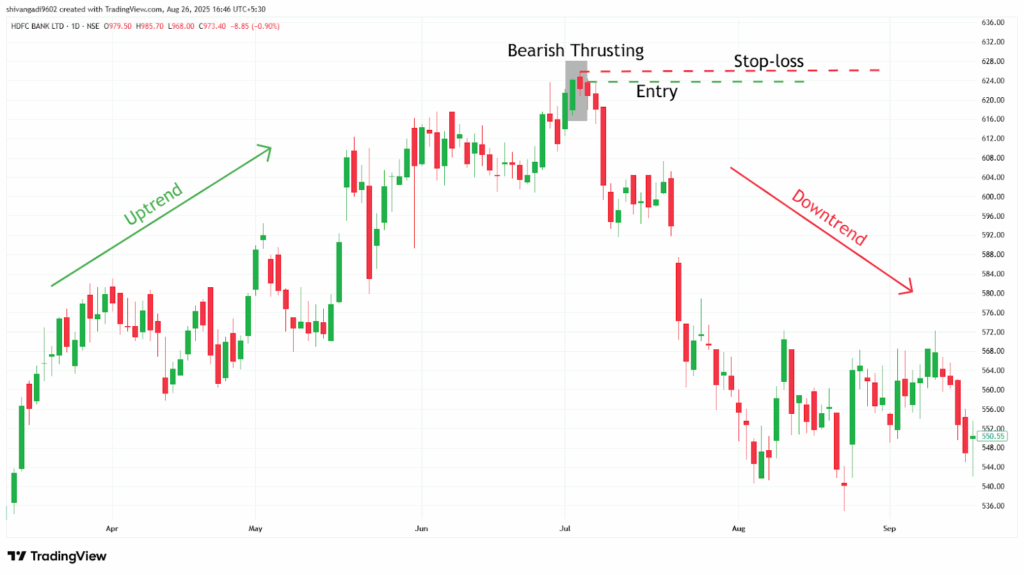
In the image below, you can look at the chart of “ HDFC Ltd” stock at a 1-day timeframe on 2nd and 3rd July 2019, and you can see the sell signal generated by the Bearish Thrusting candlestick pattern.
What are the advantages of the Bearish Thrusting pattern
- The Bearish Thrusting pattern is easy to spot and versatile across all timeframes, providing clear entry and exit points for all traders.
- If you have the entry, then the Bearish Thrusting candlestick pattern provides an optimal point to re-enter the trade with minimal risk.
- The high of the second candlestick in the pattern acts as a strong resistance level for further price action.
What are the disadvantages of the Bearish Thrusting pattern
- It is not possible to capture the entire trend, as a large portion of the downtrend is already over.
- For the upcoming downtrend, the Bearish Thrusting pattern requires high volume in the downtrend direction, or it results in a false signal.
- The Bearish Thrusting signals the potential reversal, but does not describe the strength of the trend.
In Closing
In this article, we covered the Bearish Thrusting candlestick pattern, its structure, the psychology of the pattern, how to trade it, along with an example, its advantages, and disadvantages.
The Bearish Thrusting pattern is a powerful tool that signals a reversal of the prior uptrend and leads the price action, making it more efficient, and it indicates multiple opportunities for clear entry and exit signals.
Your profitability depends on your approach to the trade, your risk management, and your mindset when you are holding the trade, as no indicator or tool is 100% accurate, and when the Bearish Thrusting candlestick pattern is combined with additional indicators or tools (RSI, MACD, or others), its efficiency and accuracy increase rapidly.
