
In trading, technical analysis helps traders study price charts and patterns to anticipate future market movements. Chart patterns, in particular, serve as visual representations of market psychology, signaling whether a trend is likely to continue or reverse. Among these, the Bullish Symmetrical Triangle is a well-known continuation pattern that often indicates the possibility of a strong upward breakout during an ongoing uptrend.
In this article, we will discuss the Bullish Symmetrical Triangle Chart Pattern, its structure, how to identify it, how to trade it with an example, its advantages, and disadvantages.
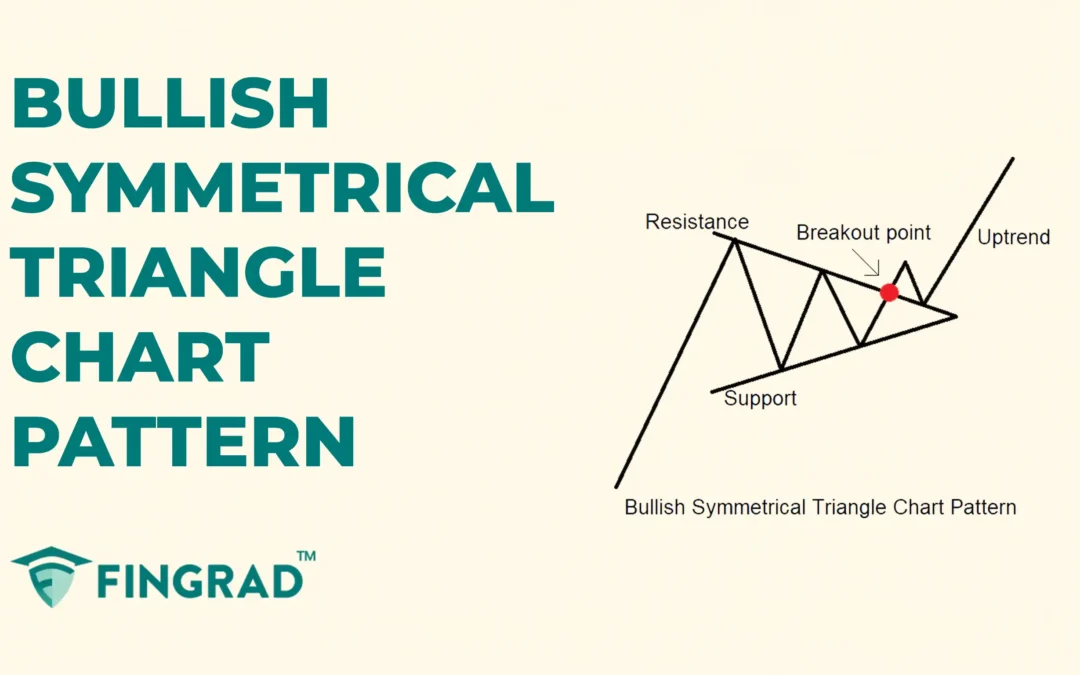
What is the Bullish Symmetrical Triangle chart pattern?
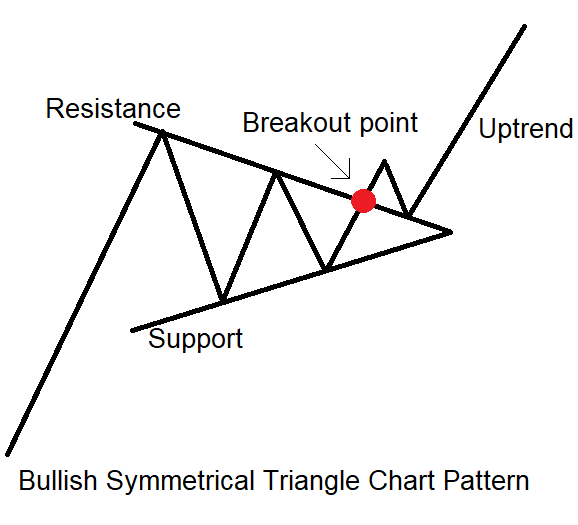
The Bullish Symmetrical Triangle Chart Pattern is a consolidation pattern formed when the price moves within two trendlines, followed by a bullish breakout. Two converging trendlines define the range; the line above is the resistance line, and the line below is the support line in an ongoing uptrend.
The Bullish Symmetrical Triangle pattern can form over days, weeks, or even months, depending on the price action.
Once this consolidation of the price is over, the price typically breaks out to begin a strong bullish trend after the pattern is formed.
Structure:
- Converging Trendlines: On the price chart, two trendlines are drawn
- Upper trendline: Drawn by connecting a series of lower highs.
- Lower trendline: Drawn by connecting a series of higher lows.
To increase the readability, the pattern must have at least 2–3 touches on each trendline.
- Interpretation: The pattern is formed during the consolidation, or a small pullback of the price.
- Breakout Confirmation: When the bullish candle closes above the upper trendline, the pattern is considered confirmed.
How to identify the Bullish Symmetrical Triangle Pattern?
Identify the security in an uptrend, and wait for a pullback in the price. Then draw two trendlines connecting the lower highs and higher lows, which converge toward a point, forming a triangle.
As price consolidates, trading volume typically declines, indicating indecision in price action and reduced volatility.
Wait for a breakout candlestick: The pattern is confirmed when the price closes above the resistance line, and the signal to trade the security in an upward direction.
How to trade the Bullish Symmetrical Triangle chart pattern?
Buy signal:
Entry:
- When the price closes above the upper trendline with a confirmed breakout, plan an entry for a long position.
Stop-loss:
- Place the stop-loss at the low of the most recent swing low within the triangle.
Target:
- Set the target, measure the height of the triangle at its widest point, and project that distance from the breakout point.
Target Price = Breakout Point + (Height of the Triangle)
- Or set your target according to your risk-reward ratio.
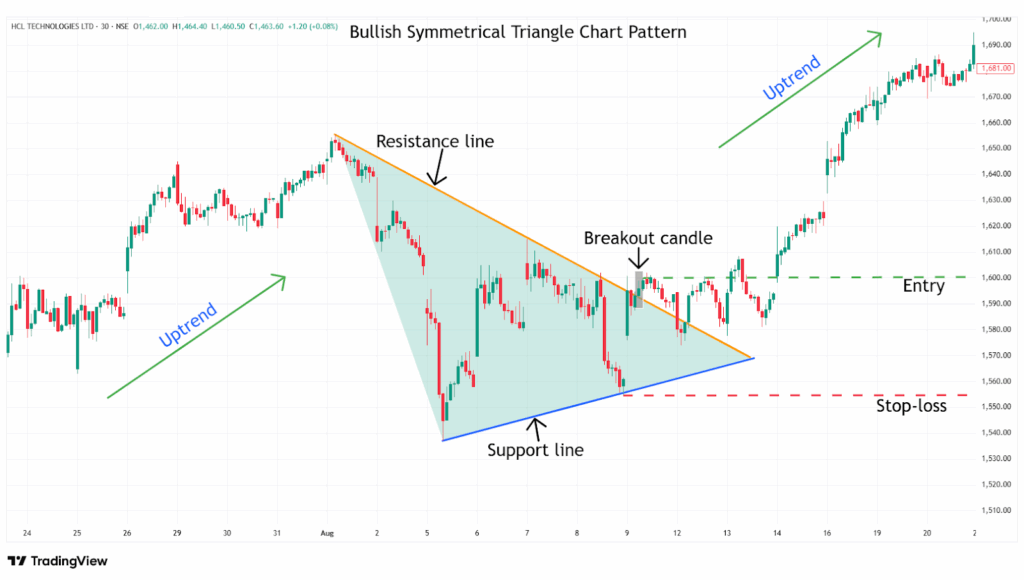
Example:
In the image below, you can look at the chart of “ HCL Technologies Ltd” stock at a 30-minute timeframe from 1st to 9th August 2024, and you can see the buy signal generated by the Bullish Symmetrical Triangle Chart Pattern.
What are the advantages of the Bullish Symmetrical Triangle Pattern?
- The Bullish Symmetrical Triangle pattern is one of the highly reliable bullish continuation patterns in technical analysis.
- The trendline of the Bullish Symmetrical Triangle pattern acts as a strong support after the breakout of the pattern.
- The Bullish Symmetrical Triangle pattern provides a clear entry, stop-loss, and target to trade for everyone.
- The Bullish Symmetrical Triangle pattern is versatile across all timeframes and all other security markets, as a single strategy can be applicable for all markets.
What are the disadvantages of the Bullish Symmetrical Triangle pattern?
- False breakouts can happen in a Symmetrical Triangle when the price moves above the trendline with low volume and then it quickly reverses, especially during a sideways market.
- By the time the Bullish Symmetrical Triangle pattern confirms, much of the move may have already happened.
- The Bullish Symmetrical Triangle pattern is hard to identify, especially during volatile market conditions.
- The Bullish Symmetrical Triangle pattern often takes a long time to develop, especially on higher timeframes.
In Closing:
In this article, we explored the Bullish Symmetrical Triangle pattern, its structure, how to identify it, how to trade it, along with an example, its advantages, and disadvantages.
The Bullish Symmetrical Triangle pattern is a powerful tool that signals potential bullish continuation in the ongoing uptrend, and it indicates multiple opportunities for clear entry and exit signals.
Your profitability depends on your approach to the trade, your risk management, and your mindset when you are holding the trade, as no indicator or tool is 100% accurate, and when the Bullish Symmetrical Triangle pattern is combined with additional indicators or tools (RSI, MACD, or others), its efficiency and accuracy increase rapidly.
