
When your trading is based on technical analysis, you are likely to come across tools and indicators. These tools include chart patterns, which often have a significant impact on price action, provide insight into market sentiment, and help identify optimal entry and exit points, and helps you identify the optimal entry and exit points during the trade.
In this article, we will understand the Butterfly Chart Pattern, its structure, how to identify it, how to trade it with an example, its advantages, and disadvantages.
What is the Butterfly Chart Pattern
The Butterfly chart pattern is a reversal pattern used in both bullish and bearish contexts and is designed to anticipate trend reversals based on Fibonacci ratios.
The pattern is built using specific Fibonacci ratios and consists of five key points: X, A, B, C, and D. It forms after a series of price movements that follow a defined structure and ends at point D, where a reversal is expected.
- Bullish Butterfly – It signals a potential uptrend reversal after a downtrend.
- Bearish Butterfly – It signals a potential downtrend reversal after an uptrend.
Structure of Butterfly Chart Pattern
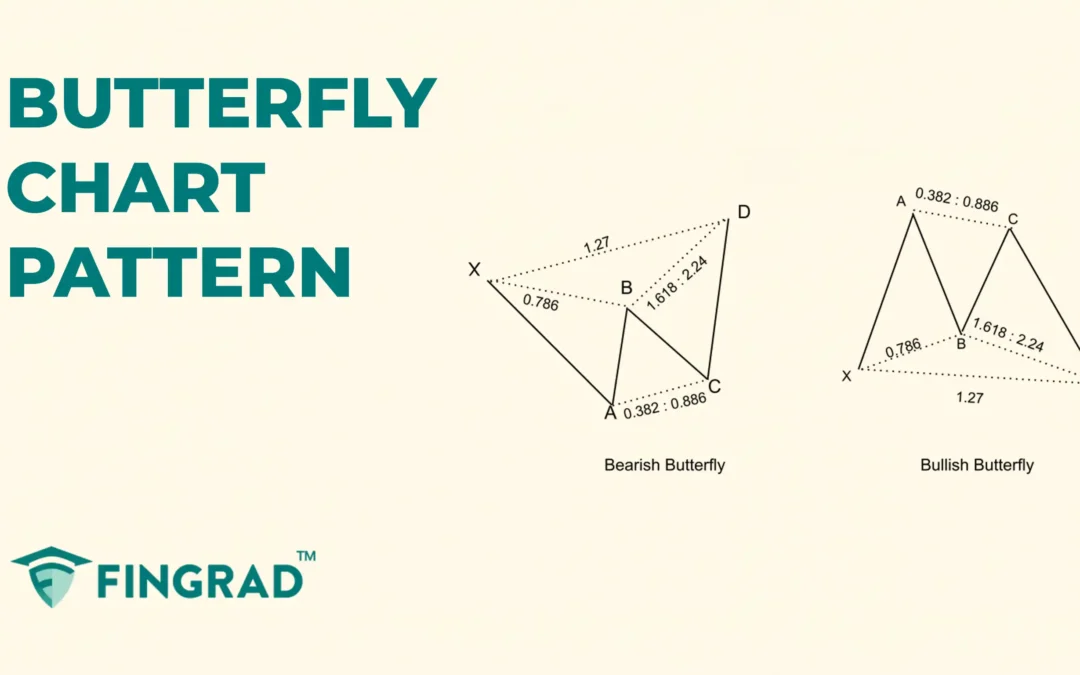
The Butterfly pattern consists of five points (X, A, B, C, D) and four legs: XA, AB, BC, and CD. The pattern starts from X and ends at D.
- XA: It is an initial move that can be up (in a bearish pattern) or down (in a bullish pattern).
- AB: The first correction that typically retraces about 0.786 of the XA leg.
- BC: It is the next move in the direction according to the trend, and it retraces between 0.382 to 0.886 of the AB leg.
- CD: It is the final and most important leg, as it extends beyond point X, ideally reaching between 1.272 to 1.618 of the XA leg using a Fibonacci extension tool.
And as the pattern finishes at point D, it indicates the reversal in an ongoing trend.

How to identify the Butterfly chart pattern
Bullish Butterfly Chart Pattern
- In a downtrend, validate AB is approximately 0.786 of XA; then BC retraces 0.382–0.886 of AB; finally CD extends beyond X toward the 1.272–1.618 XA extension (with a compatible BC projection), forming the D zone.
- Once a strong bullish candle closes above the high of the candle at point D, the pattern is confirmed, then plan for a long trade.
Bearish Butterfly Chart Pattern
- In an uptrend, validate AB is approximately 0.786 of XA; then BC retraces 0.382–0.886 of AB; finally CD extends beyond X toward the 1.272–1.618 XA extension (with a compatible BC projection) to mark D.
- As the strong bearish candle closes below the low of the previous candle of the point D, the pattern is confirmed, then plan for a short trade.
How to trade the Butterfly Chart Pattern
Buy Signal:
Entry:
- Plan for a long position after the closing of a bullish candle appears at the D point with an increase in the buying volume.
Stop-loss:
- Place the stop-loss at the low of the candle on the D point or at the low of the most recent swing on the bottom.
Target:
- Set the primary target to point A.
- Place it based on your preferred risk-reward ratio, depending on your trading strategy or the next resistance line.
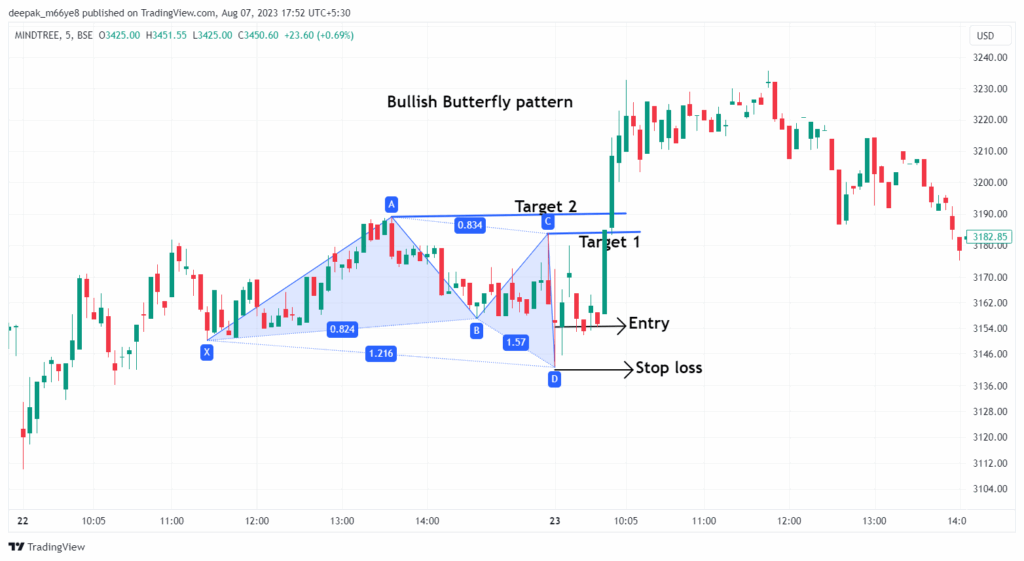
Example:
The chart below illustrates the stock of MindTree Ltd in a 5-minute timeframe, highlighting the buy signal generated by the Bullish Butterfly chart pattern.
Sell Signal:
Entry:
- Plan for a short position after the closing of a bearish candle appears at the D point with an increase in the selling volume.
Stop-loss:
- Place the stop-loss at the high of the candle on the D point or at the high of the most recent swing on top.
Target:
- Set the primary target to point A.
- Place it based on your preferred risk-reward ratio, depending on your trading strategy or the next resistance line.
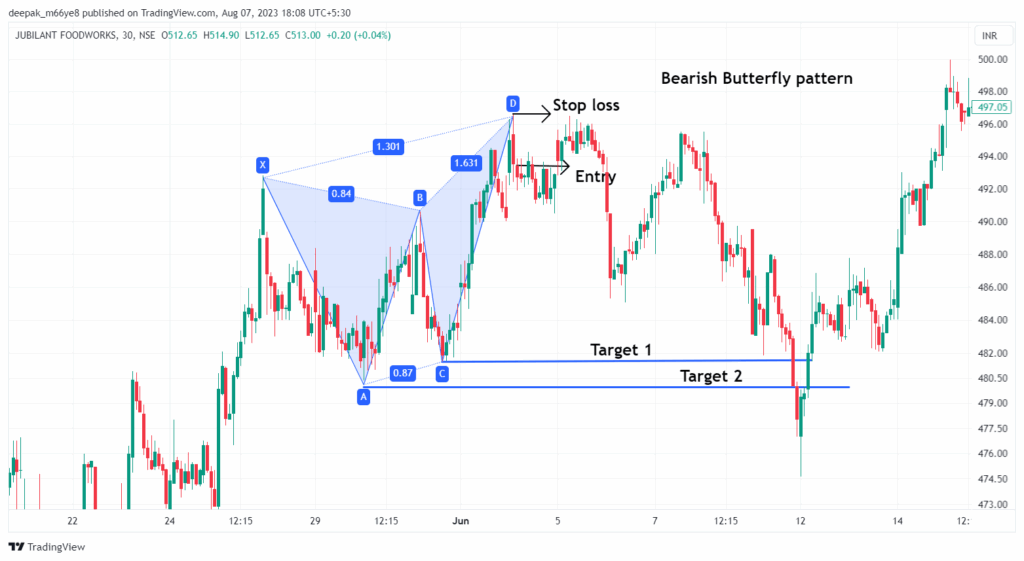
Example:
The chart below illustrates an example of “Jubilant Foodworks” stock in a 30-minute timeframe, showing the sell signal generated by the Bearish Butterfly chart pattern.
What are the advantages of the Butterfly chart pattern?
- The Butterfly chart pattern provides a clear understanding of the price action and provides clearly defined entry, stop-loss, and target levels.
- The Butterfly chart pattern is versatile and applicable across all timeframes and markets.
- The pattern acts as resistance in a bearish setup or support in a bullish setup on initial tests, but this behaviour is not guaranteed.
- Targets are typically derived from structure (moves toward C and A) and Fibonacci projections/retracements rather than “pattern depth.
The disadvantages of the Butterfly chart pattern:
- A false signal can occur in a Butterfly chart pattern, and the price can quickly reverse again, especially in low-volume or sideways market conditions.
- By the time the Butterfly chart pattern confirms, much of the move may have already happened, which affects your risk-reward ratio.
- The Butterfly chart pattern often takes a long time to develop, especially on higher timeframes.
In Closing
In this article, we learned the Butterfly chart pattern, its structure, how to identify it, how to trade it, along with an example, its advantages, and disadvantages.
The Butterfly chart pattern is a powerful tool that signals the potential reversal in the ongoing trend, indicating multiple opportunities for clear entry and exit signals.
Your profitability depends on your approach to the trade, your risk management, and your mindset when you are holding the trade, as no indicator or tool is 100% accurate in financial market across the world, and as the Butterfly chart pattern’s efficiency and accuracy increase rapidly when it is combined with additional indicators or tools (RSI, MACD, or others), and traders should backtest this pattern on various timeframes and instruments to better understand its strengths and limitations.
