by FinGrad | Oct 3, 2025 | Technical Analysis
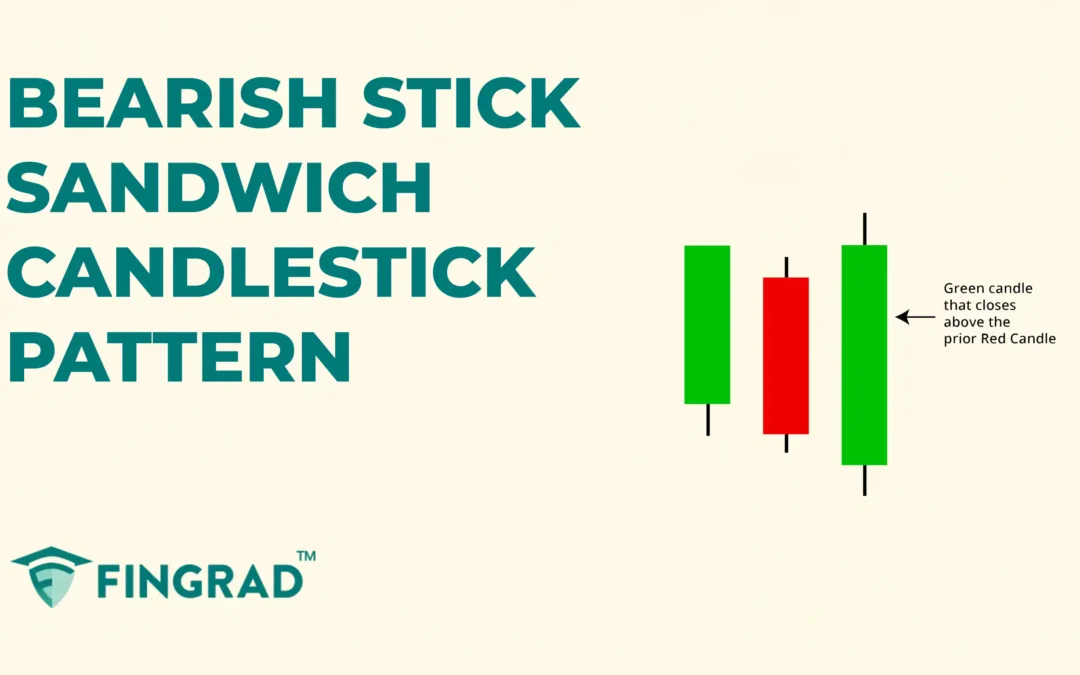
In Technical analysis, there are candlestick patterns that are rare to spot, and when spotted, they give a strong directional movement according to the type of the pattern, and one such pattern is the Bearish Stick Sandwich candlestick pattern. It is a powerful...
by FinGrad | Oct 1, 2025 | Technical Analysis
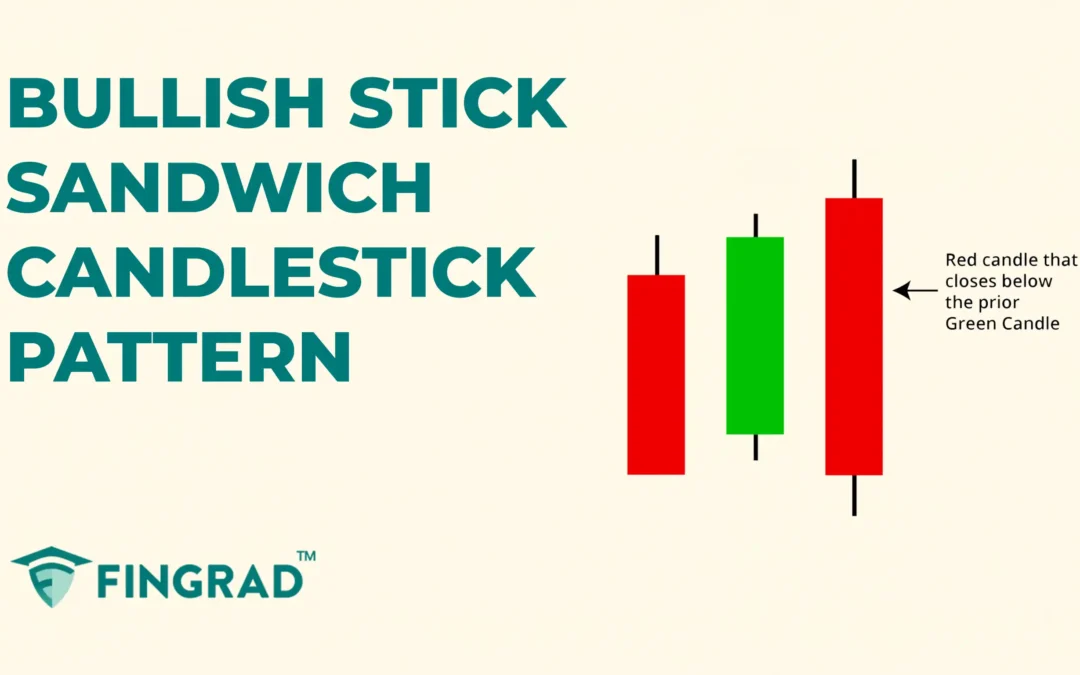
In Technical analysis, some candlestick patterns are rare to spot, and when spotted, they give a strong directional movement according to the type of the pattern, and one such pattern is the Bullish Stick Sandwich candlestick pattern. It is a powerful candlestick...
by FinGrad | Sep 29, 2025 | Technical Analysis
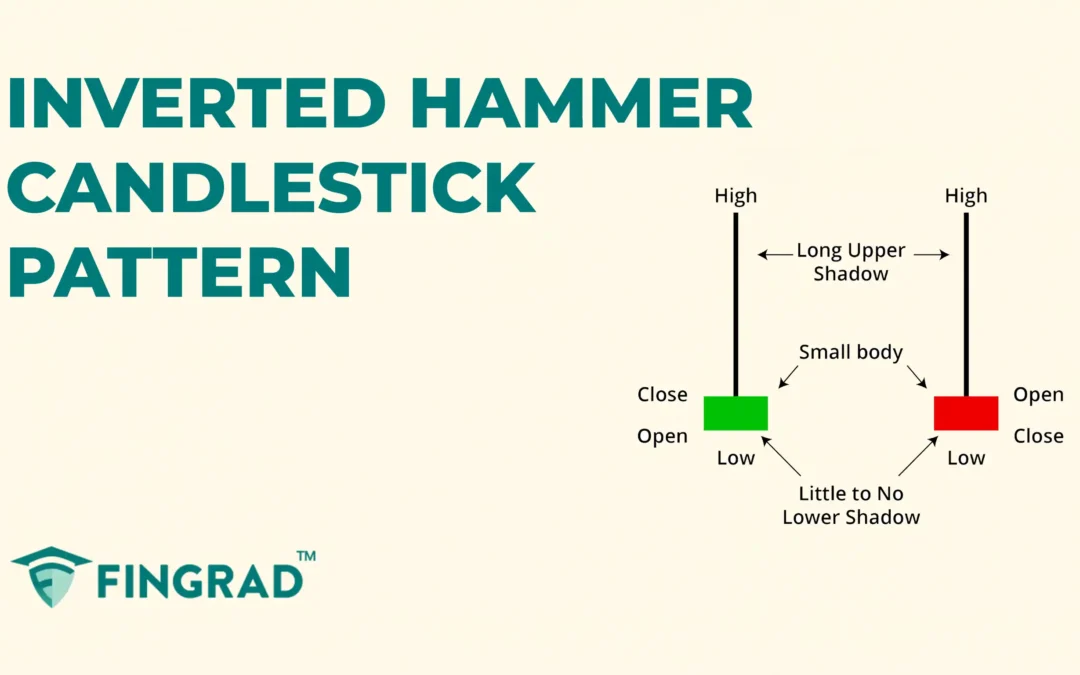
Technical analysis involves tools and indicators that provide you with a better understanding of the price action to develop your trading strategies. Among such powerful tools that are easy to spot and trade and a single candlestick capable of changing trends is a...
by FinGrad | Sep 25, 2025 | Technical Analysis
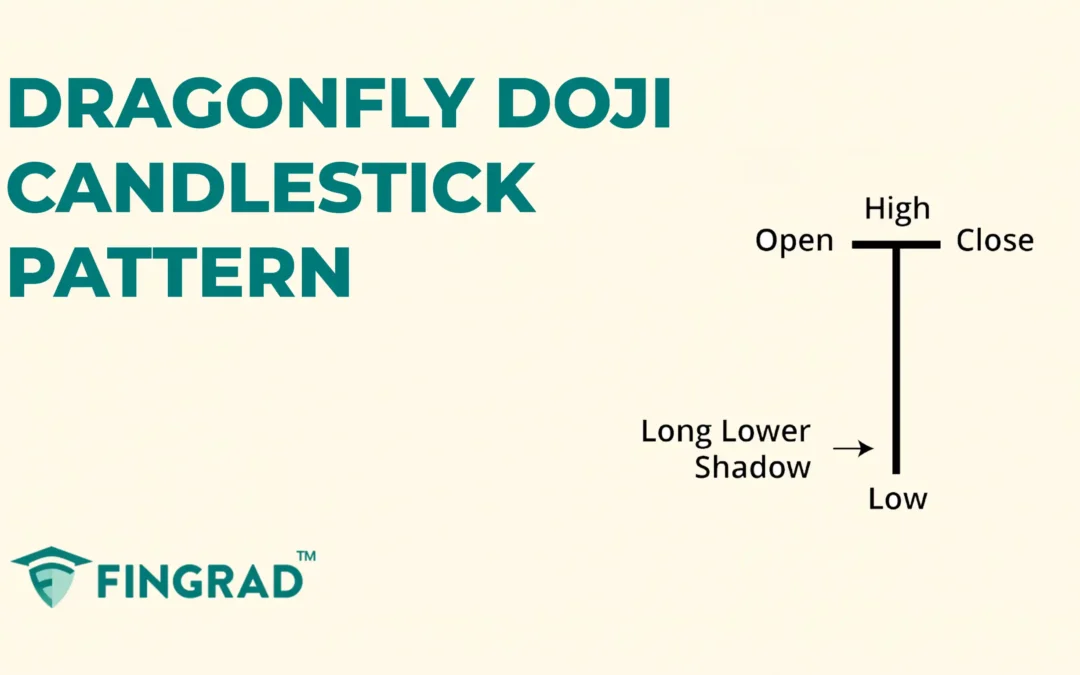
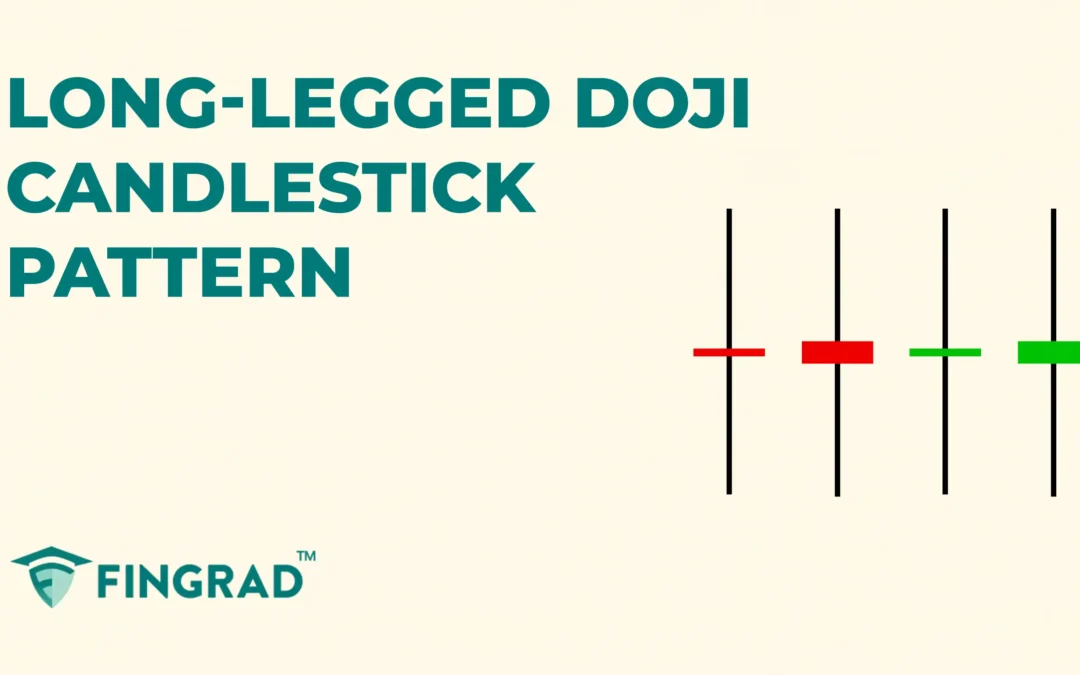
In all financial markets, candlesticks display the sentiment of the price action and the strength of buyers and sellers. When the strength between the buyer and seller is matched, the Doji candlestick is formed. In this article, we will discuss one of the Doji...
by FinGrad | Sep 25, 2025 | Technical Analysis
In technical analysis, candlestick patterns are one of the most effective tools for understanding market psychology and predicting potential price movements. These patterns reflect the constant battle between buyers and sellers, helping traders identify areas of...
by FinGrad | Sep 24, 2025 | Technical Analysis
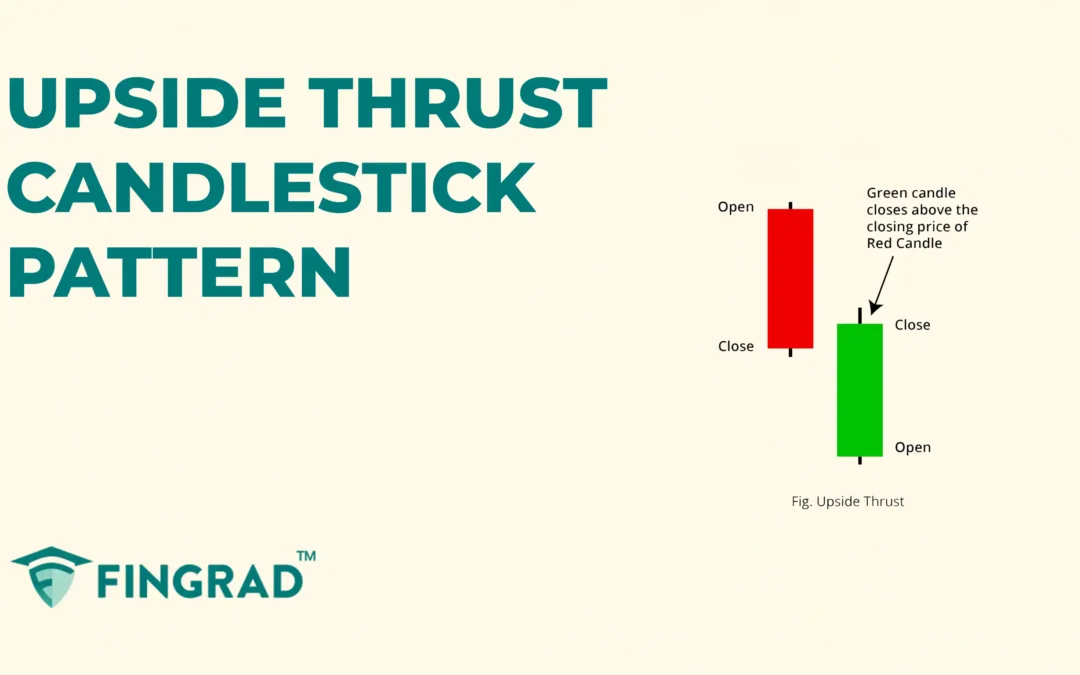
In trading or investing, identifying highly efficient, accurate, and low-risk candlestick patterns is hard, not impossible. The Upside Thrust is one such pattern. For beginners, it is easy to spot and offers a very low probability of trade failure. In this article, we...

