by FinGrad | Sep 23, 2025 | Technical Analysis
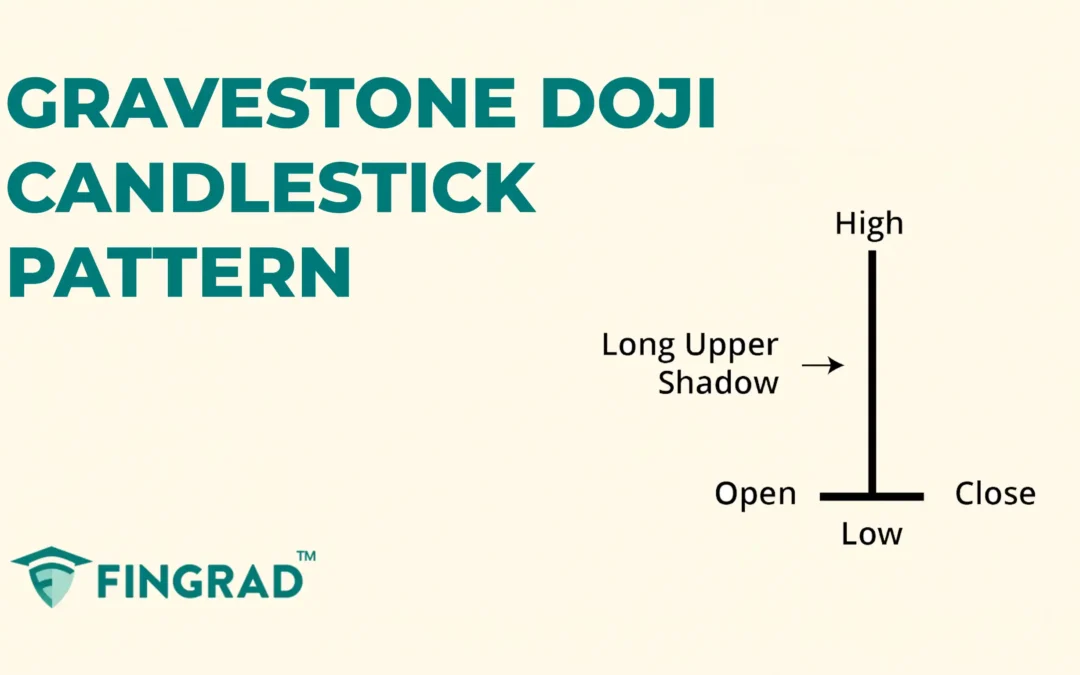
In trading, candlestick patterns are one of the most widely used tools to analyze market sentiment and predict potential price reversals. They reflect the ongoing battle between buyers and sellers, offering traders valuable insights into trend strength, uncertainty,...
by FinGrad | Sep 22, 2025 | Technical Analysis
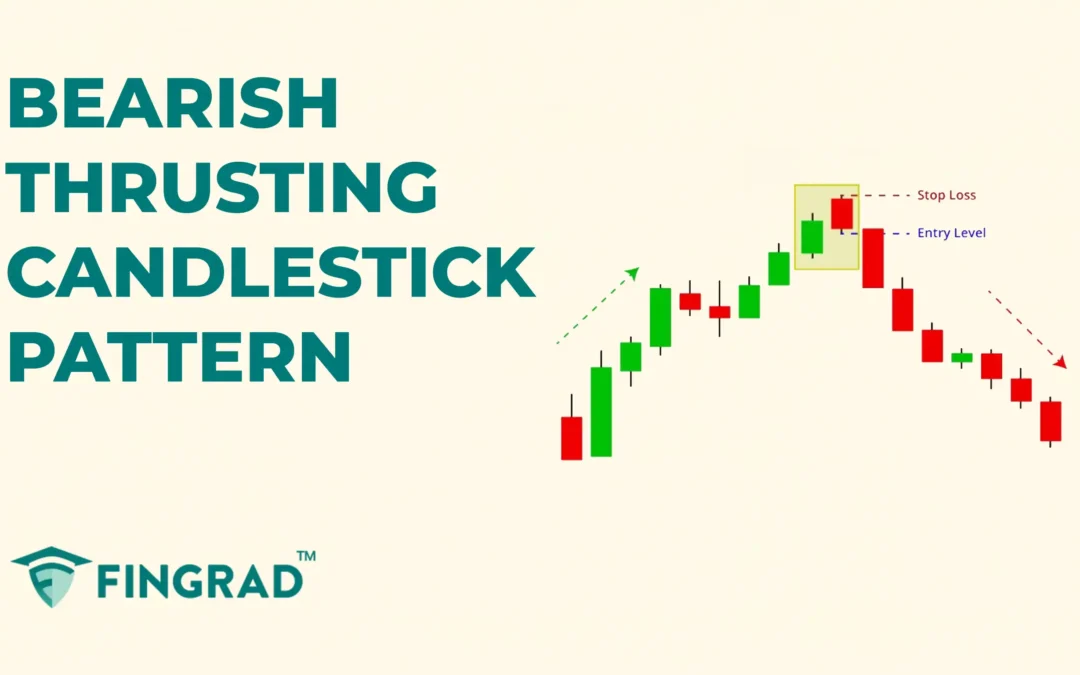
In trading, technical analysis is one of the most effective ways to understand market behaviour by studying price movements and chart patterns. Among these patterns, candlestick formations play a key role as they reflect market sentiment and help traders anticipate...
by FinGrad | Sep 22, 2025 | Technical Analysis
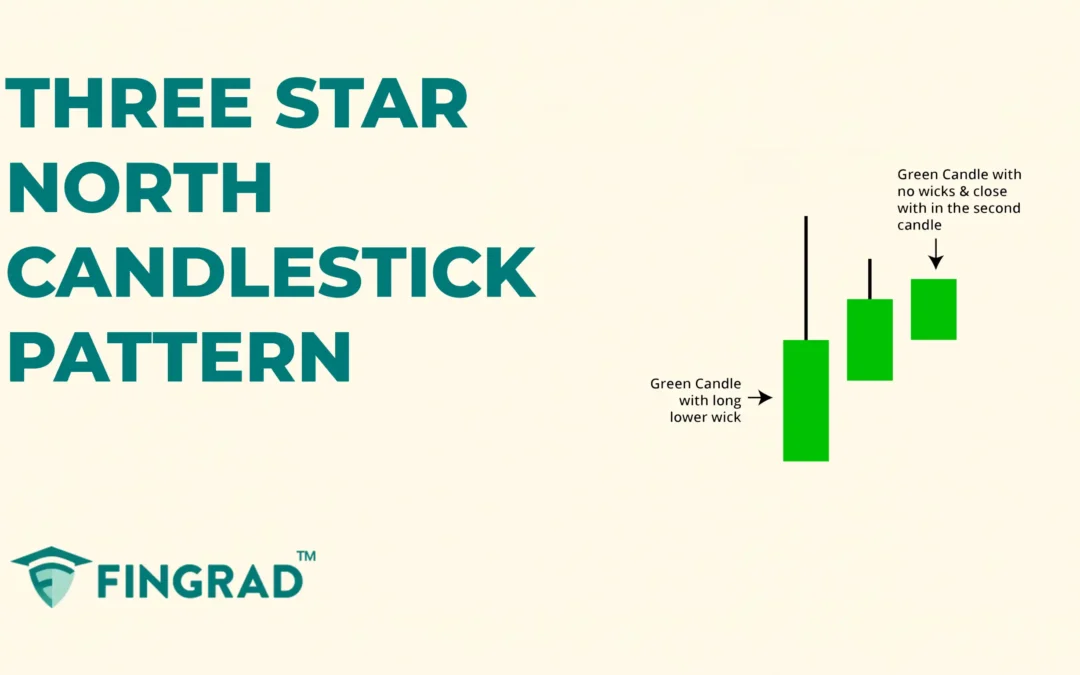
In Technical analysis, there are candlestick patterns that are rare to spot, and when they are spotted, they indicate a strong directional movement of the type of pattern. And one such pattern is the Three Star North candlestick pattern. It is a powerful candlestick...
by FinGrad | Sep 19, 2025 | Technical Analysis
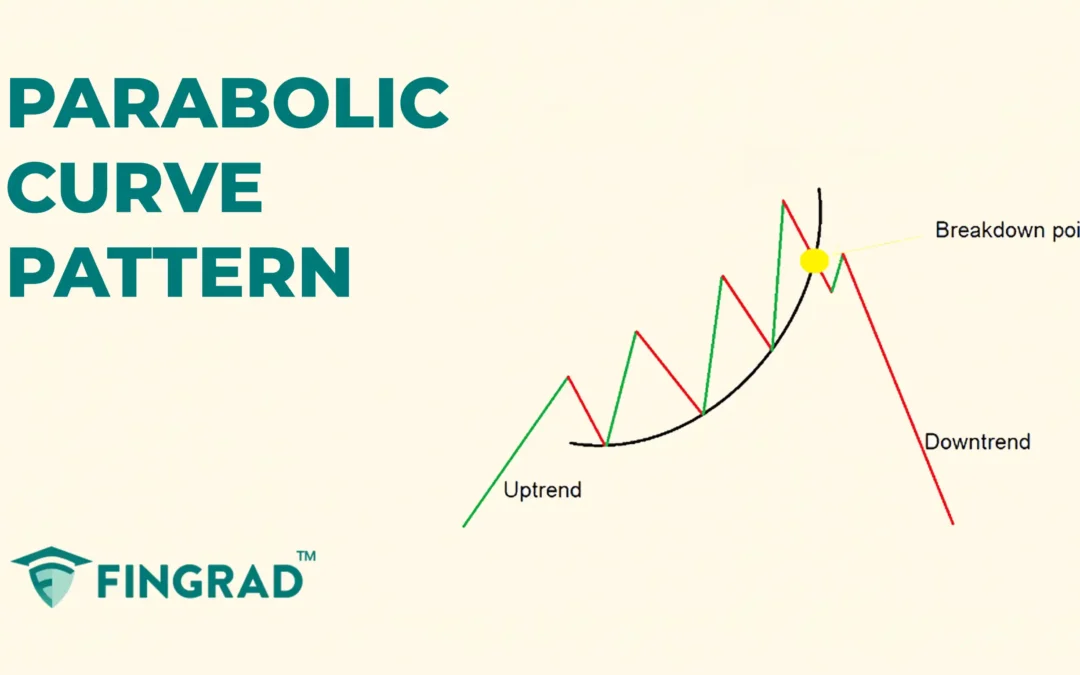
For new traders looking to understand trend shifts, learning chart patterns can help highlight potential reversals and continuations, though they aren’t always easy to spot and never guarantee minimal risk. Then, the Parabolic Curve pattern is an important tool to...
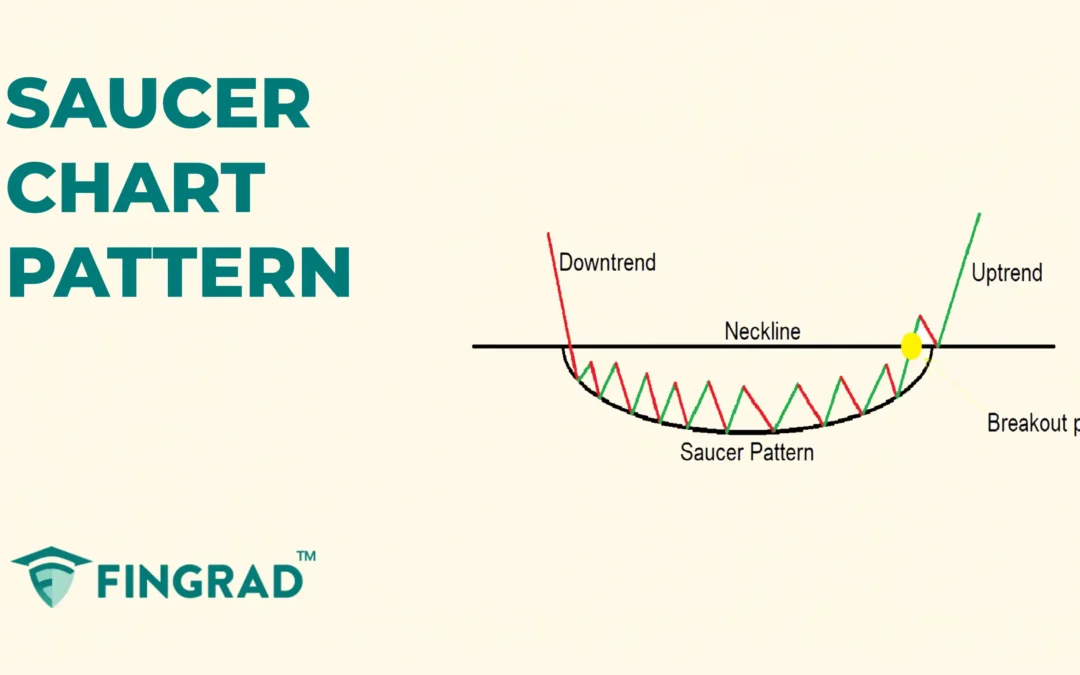
by FinGrad | Sep 19, 2025 | Technical Analysis
Across all the financial markets in the world, technical analysis gives an understanding of the price action and the strength of the buyers and sellers. Technical analysis involves chart patterns for identification, pattern analysis, strategy building, and...
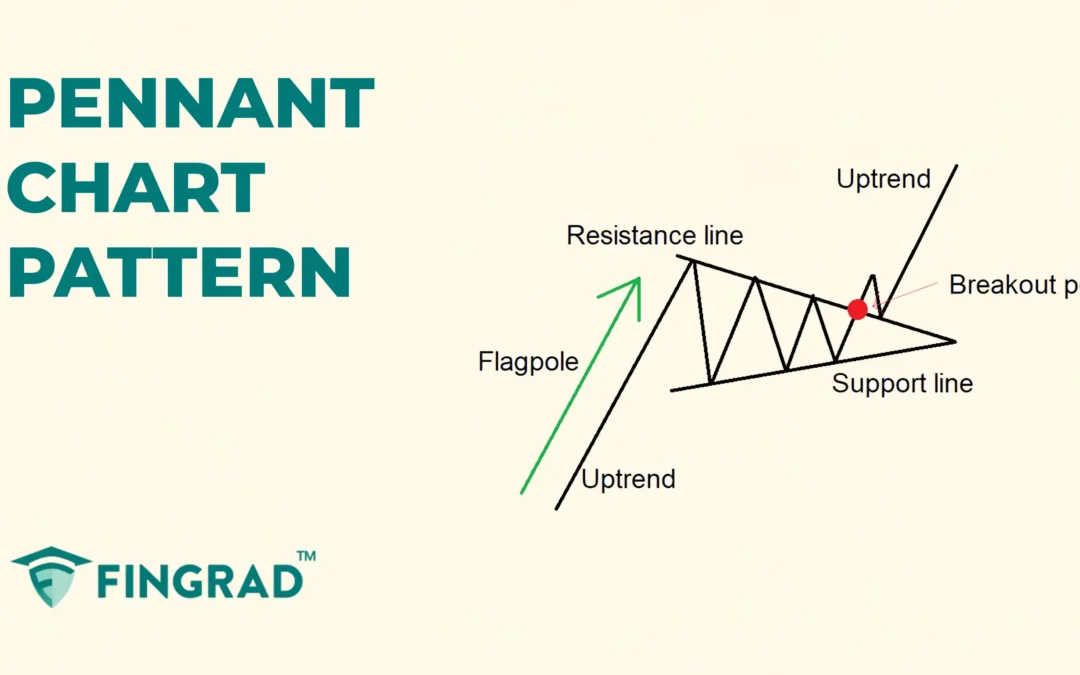
by FinGrad | Sep 18, 2025 | Technical Analysis
For new traders seeking to understand trend dynamics, learning chart patterns can help highlight potential reversals and continuations, though they are not always easy to spot and never guarantee minimal risk. The Pennant Chart Pattern is an important tool to start...

