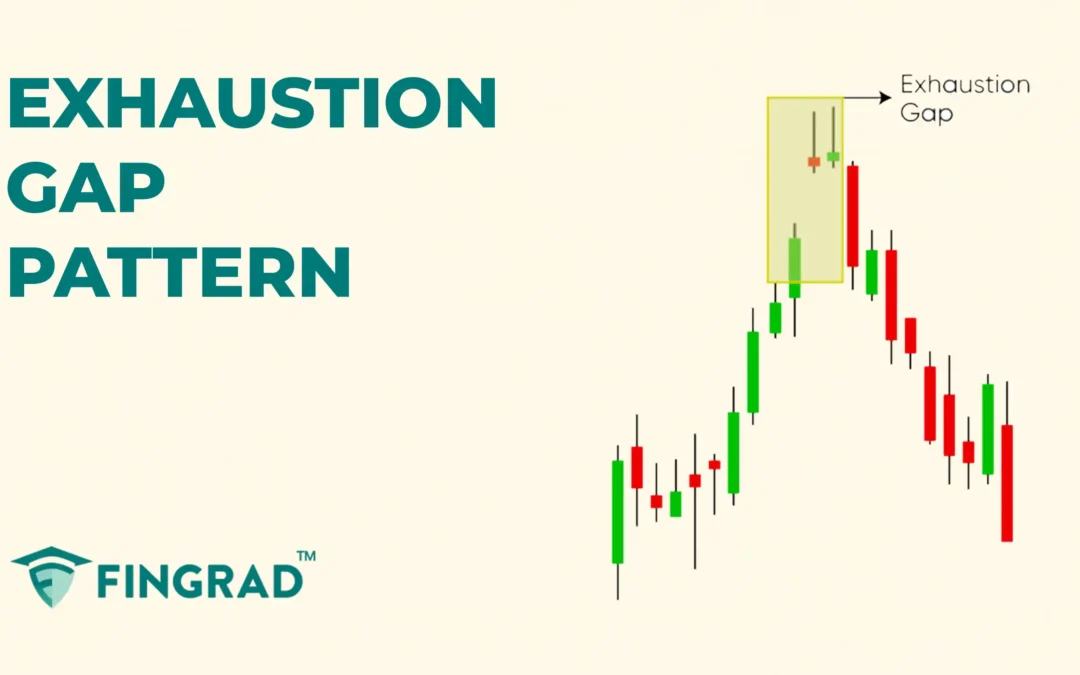
by FinGrad | Sep 18, 2025 | Technical Analysis
In technical analysis, traders use a variety of tools and patterns to analyse price movement and have a huge impact on the price, provide a clear understanding of the price sentiment, and help identify the optimal entry and exit points during the trade. In the article...
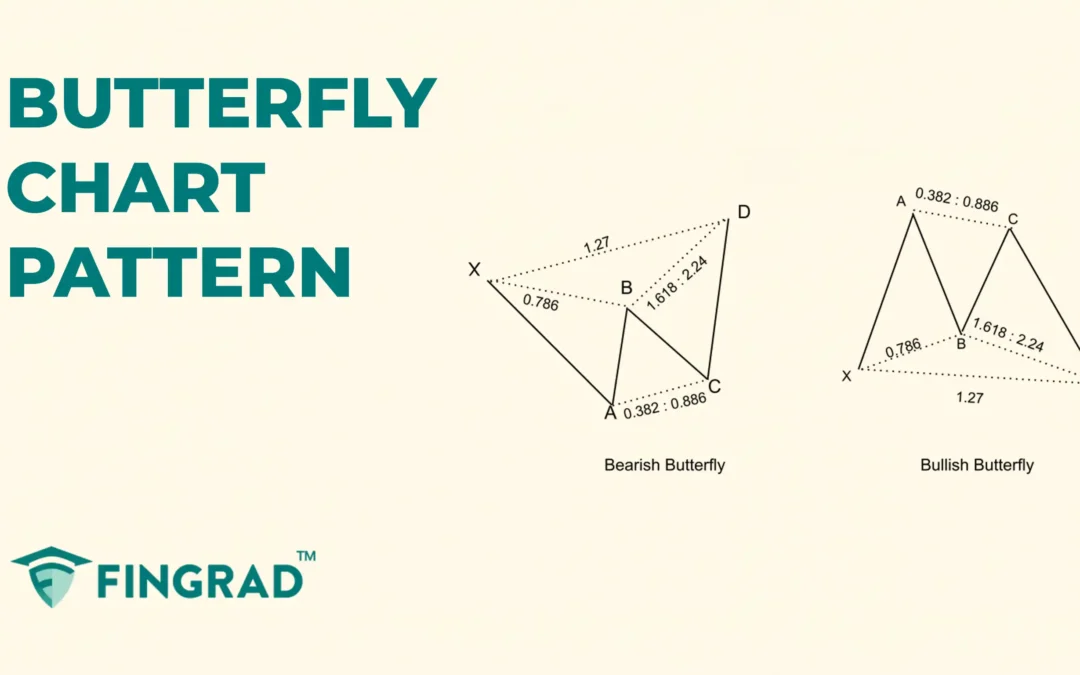
by FinGrad | Sep 17, 2025 | Technical Analysis
When your trading is based on technical analysis, you are likely to come across tools and indicators. These tools include chart patterns, which often have a significant impact on price action, provide insight into market sentiment, and help identify optimal entry and...
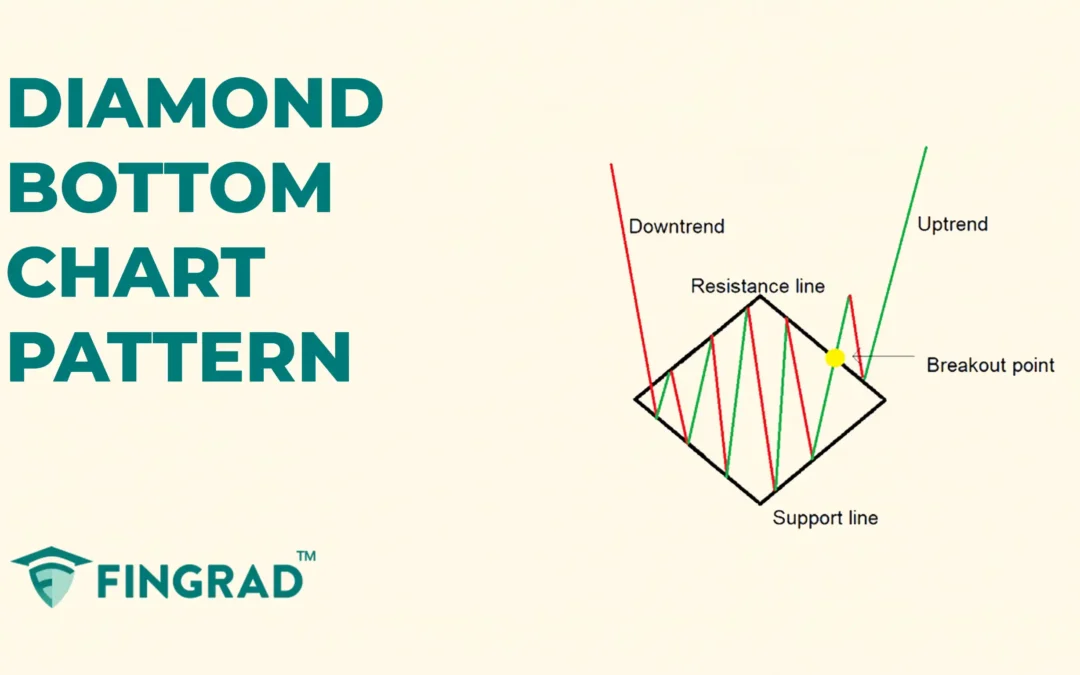
by FinGrad | Sep 17, 2025 | Technical Analysis
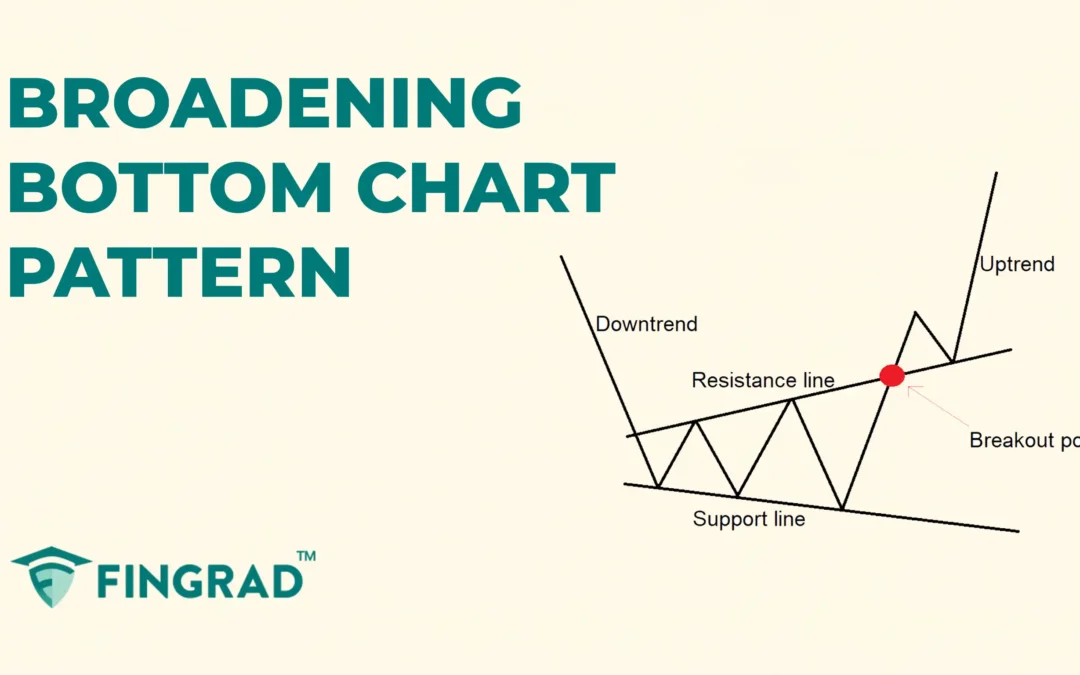
When you begin trading, it is common to experience a form of overtrading, either to make profits, recover losses, or find the optimal entry and exit points. It can help to study rarer chart patterns such as the Diamond Bottom that sometimes offer well-defined entry...
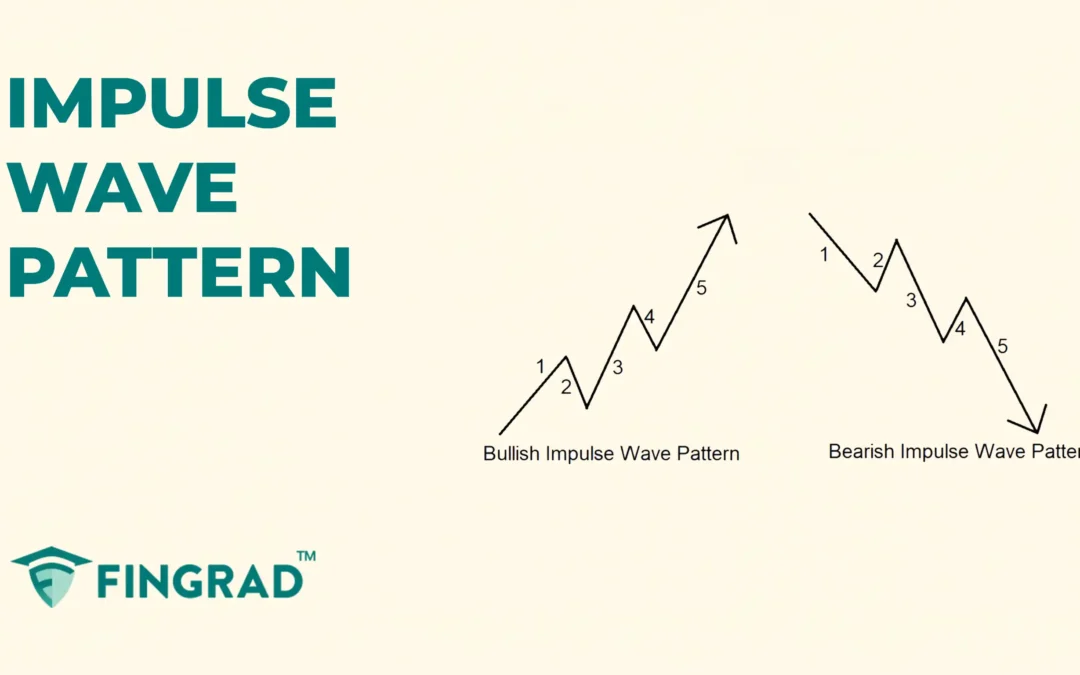
by FinGrad | Sep 16, 2025 | Technical Analysis
In financial markets worldwide, chart patterns help traders analyse the price action, trend, and volatility of markets to identify trend reversals and continuation in an ongoing trend. Technical analysis enhances your understanding of the market and makes better entry...
by FinGrad | Sep 16, 2025 | Technical Analysis
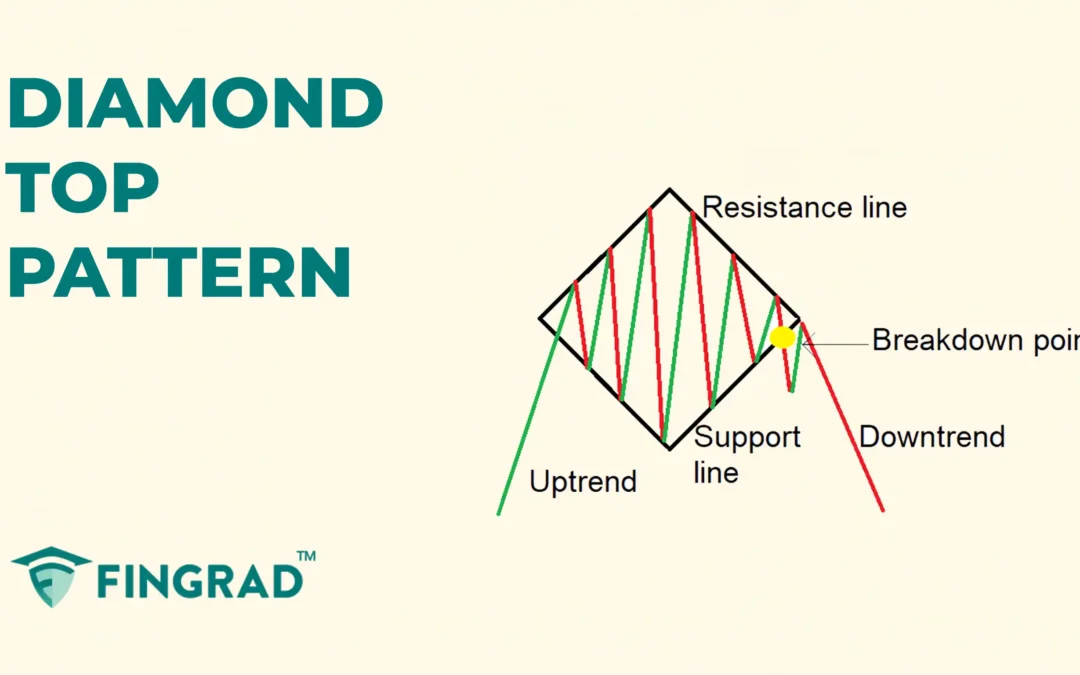
In Technical analysis, there are chart patterns that are rare to spot, and when spotted, they give a strong directional movement according to the type of the pattern, and one such pattern is the Diamond Top pattern. It is a chart pattern associated with potential...
by FinGrad | Sep 15, 2025 | Technical Analysis
When trading with technical analysis, learning chart patterns can help interpret price action and structure trades more efficiently, though they aren’t always easy to identify or trade. They also help you identify the potential reversal and continuation in the price...

