by FinGrad | Sep 5, 2025 | Technical Analysis
If you rely on technical analysis, you’ve likely come across powerful indicators and tools during your trade, such as candlestick patterns, which visually represent price action and help traders spot potential reversals or continuations of the security, making it easy...
by FinGrad | Sep 5, 2025 | Technical Analysis
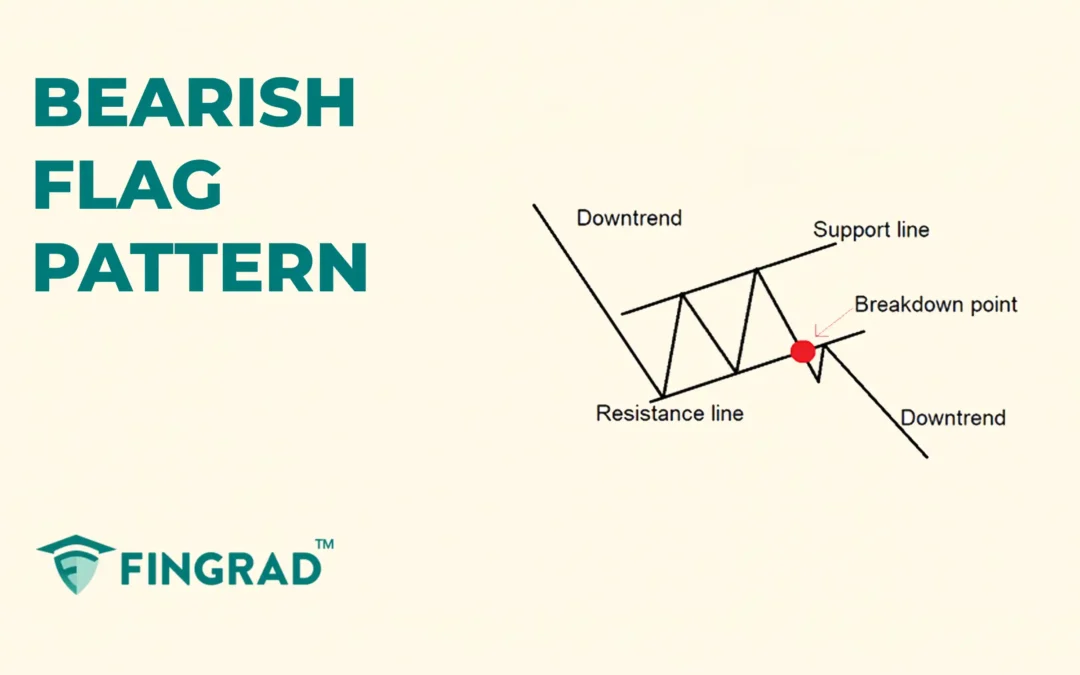
In technical analysis, chart patterns play a crucial role in helping traders identify shifts in market trends and make informed trading decisions. These formations reflect the battle between buyers and sellers and often provide early signals of potential reversals or...
by FinGrad | Sep 4, 2025 | Technical Analysis
If your trading is based on technical analysis, you’ve likely encountered powerful candlestick patterns that help identify potential trend reversals, making it easier to trade securities. Among the most reliable bullish reversal patterns is the Double Bottom...
by FinGrad | Sep 4, 2025 | Technical Analysis
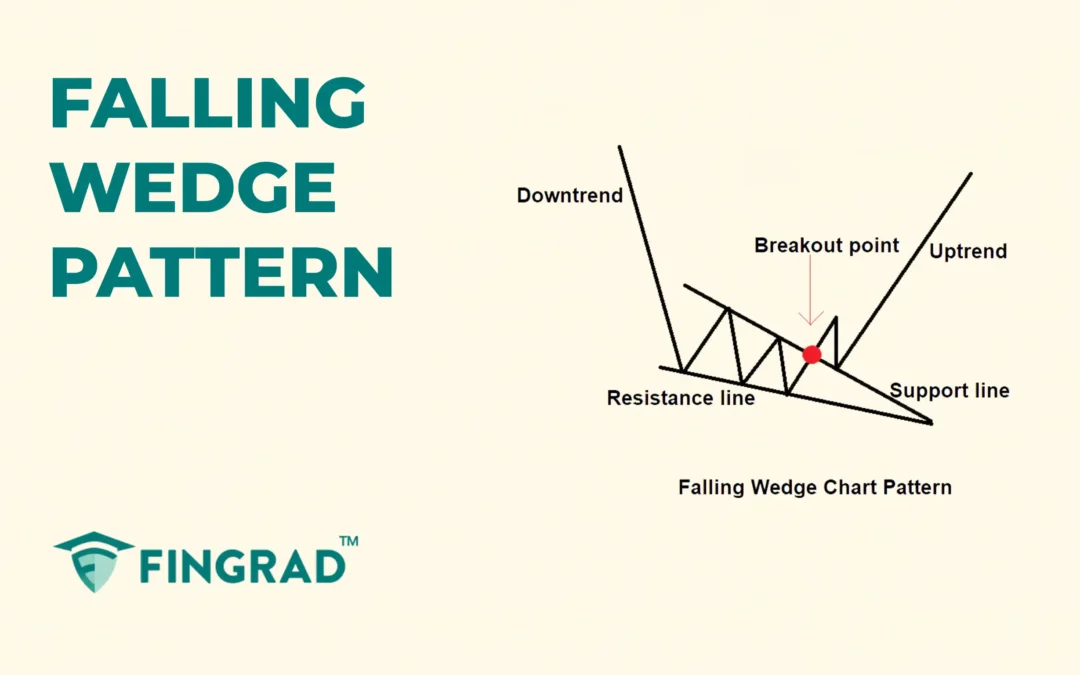
For traders seeking easily identifiable and impactful trend reversal signals. Then you must learn about the chart patterns, as they have a huge potential for trend reversal and are easy to spot and trade with minimal risk. Then, the Falling wedge pattern you should...
by FinGrad | Sep 3, 2025 | Technical Analysis
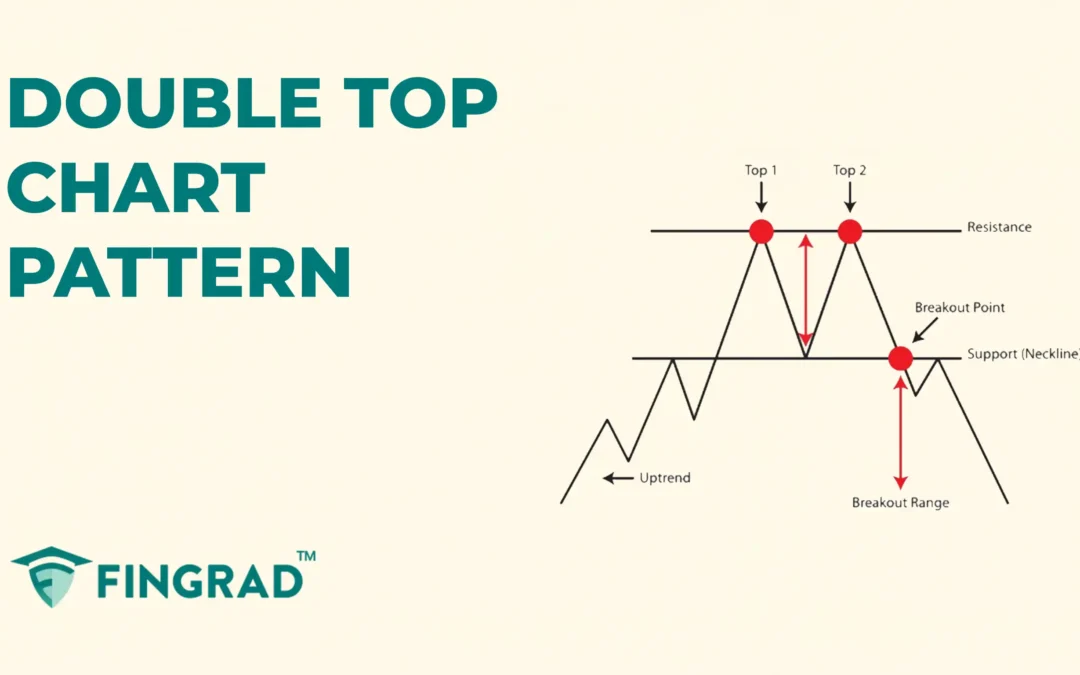
In technical analysis, chart patterns are essential tools that help traders understand price behaviour and predict future market movements. These formations often reveal whether a trend is likely to continue or reverse, giving traders clearer entry and exit points....
by FinGrad | Sep 3, 2025 | Technical Analysis
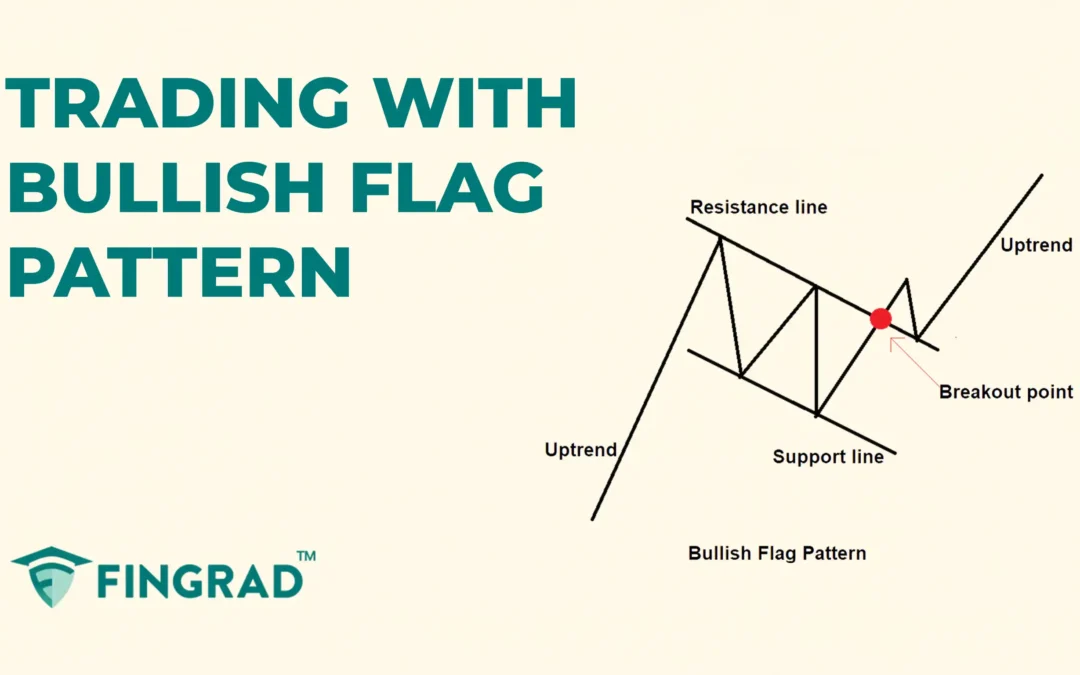
In trading, chart patterns are a key part of technical analysis, offering insights into how prices move and how trends may shift. These formations mirror the emotions of buyers and sellers in the market, providing traders with signals to anticipate upcoming price...

