
New traders often struggle to spot and enter high-probability trades due to various scenarios, a lack of confidence in the trade, a lack of risk management, or, in some cases, being slow to react to a trade opportunity. The Cup and Handle pattern is a helpful chart pattern formation that signals potential bullish continuation during an uptrend.
In this article, we will understand the Cup and Handle chart Pattern, its structure, how to identify it, how to trade it with an example, its advantages, and disadvantages.
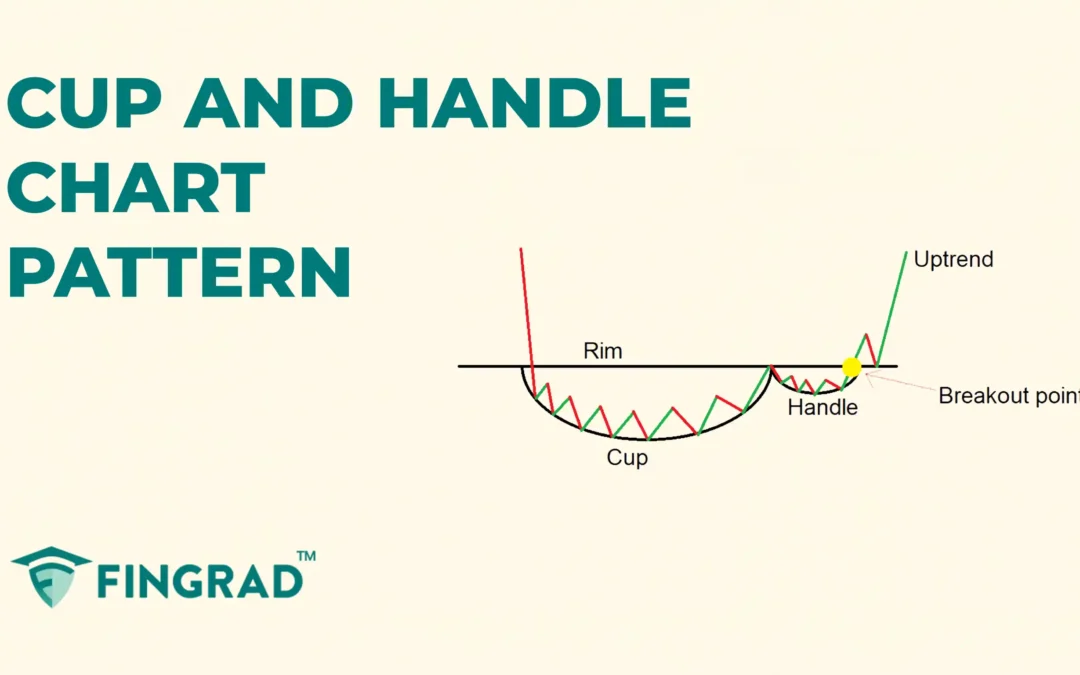
What is the Cup and Handle chart Pattern?
The Cup and Handle is a bullish continuation pattern that forms when a group of candles consolidates the price over a period, followed by a breakout to higher prices, indicating the continuation of an uptrend.
The term “cup and handle” refers to the structure of the pattern, as it resembles the shape of a cup and handle.
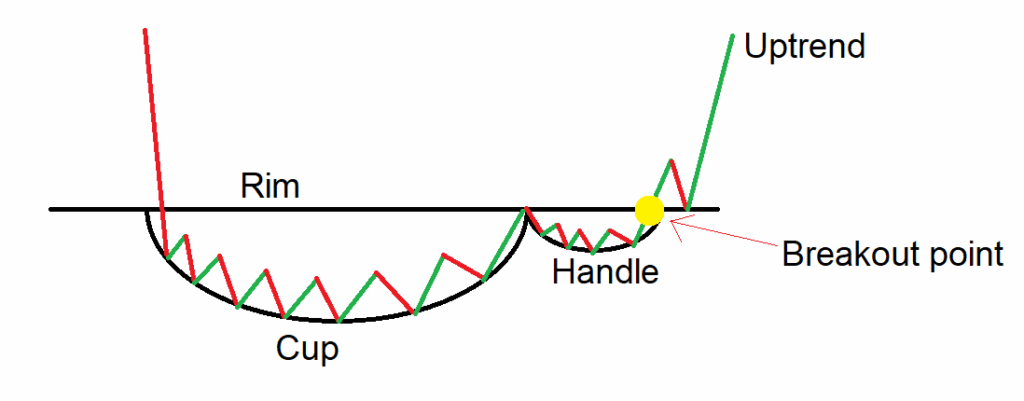
Structure
- Cup: A rounded ‘U’-shaped dip where the price gradually declines, followed by a symmetrical rise back to the previous high, and closes at or near the opening price range.
- Handle: After the price reaches the previous high, the price pulls back slightly, forming a small consolidation or downward channel resembling the “Handle” of the cup.
- Rim: It is a trendline drawn by connecting the high of the candle, and it acts as a strong resistance line in the pattern.
- Breakout: After the formation of the cup and handle is completed, the price breaks above the resistance level, signalling a potential bullish move.
How to identify the Cup and Handle chart pattern
Identify a security trading in an uptrend and wait for the price to consolidate slowly and rise back up, forming a “U” shape price action on the chart. The sides of the cup should be smooth and about the same height.
After the consolidation, watch for the handle formation. After reaching the top, the price pulls back slightly, and this dip is smaller and looks like a short pause, then look for a breakout candle as the price closes above the rim of the cup, followed by an increase in volume on the buying side, indicating strong participation and continuation of the ongoing uptrend.
How to trade the Cup and Handle chart pattern?
Buy Signal:
Entry:
- Plan a long trade on the following candle that closes above the rim of the pattern.
Stop-loss:
- The stop loss for the trade can be placed at the low of the handle of the pattern formed.
Target:
- Place the target by measuring the depth of the cup and adding it to the breakout point.
Target Price = Breakout Level + Depth of the Cup
- Or set your target based on a preferred risk-reward ratio, such as 1:1, 1:2, or higher.
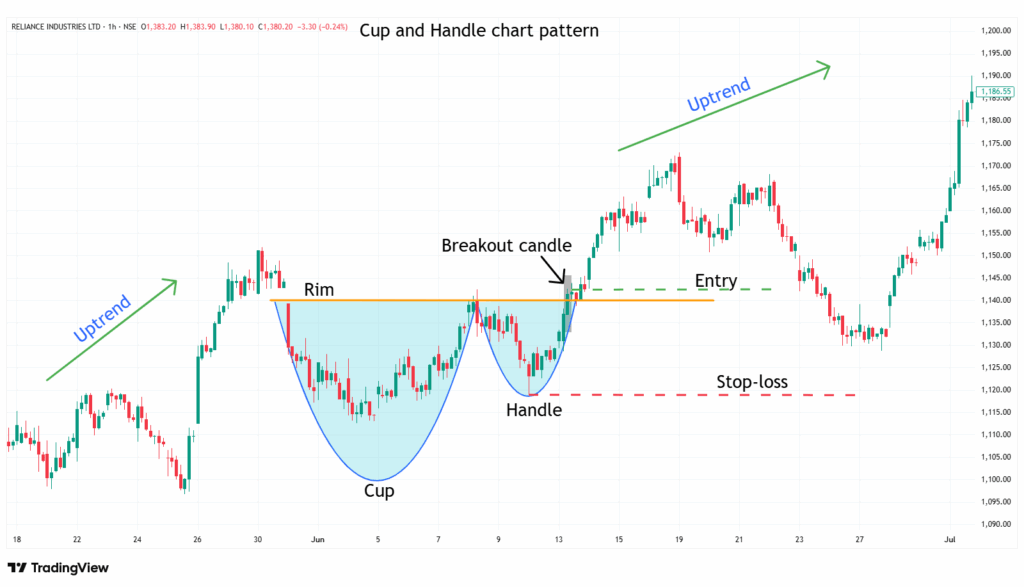
Example:
The chart below shows an example of “RIL Ltd” stock at a 1-hour timeframe from 31st May to 13th June 2023. As you can see, the buy signal was generated by the Cup and Handle chart pattern.
What are the advantages of the Cup and Handle chart pattern?
- The Cup and Handle pattern provides a clear understanding of the price action and indicates clear entry, stop-loss, and target for everyone.
- The Cup and Handle is versatile across all timeframes and all other stock markets, as a single strategy, can be applicable for all markets.
- The Cup and Handle pattern acts as a strong support level after the breakout of the pattern.
- While trading the Cup and Handle pattern, the depth of the pattern helps in calculating target levels after a breakout.
The disadvantages of the Cup and Handle chart pattern:
- False breakouts can occur in a Cup and Handle pattern, where the price may clear the rim and then reverse, especially in low‑participation or choppy markets.
- By the time the Cup and Handle confirms, much of the move may have already happened, which affects your risk-reward ratio.
- The Cup and Handle often takes a long time to develop, especially on higher timeframes.
In Closing
In this article, we learned the Cup and Handle chart pattern, its structure, how to identify it, how to trade it, along with an example, its advantages, and disadvantages.
The Cup and Handle chart pattern is a powerful tool that signals bullish continuation in the ongoing uptrend, indicating multiple opportunities for clear entry and exit signals.
Your profitability depends on your approach to the trade, your risk management, and your mindset when you are holding the trade, as no indicator or tool is 100% accurate, and as the Cup and Handle chart pattern’s efficiency and accuracy increase rapidly when it is combined with additional indicators or tools (RSI, MACD, or others).
