
If you are a trader or an inventor using technical analysis for your trades, then you must learn about the powerful chart pattern that helps traders identify potential trend reversals, making trading easier by providing a better understanding of the market sentiment and price action. Among the most reliable bearish continuation patterns is the Descending Triangle chart pattern, especially during the market’s ongoing downtrend.
In this article, we will understand the Descending Triangle chart pattern, its structure, how to identify it, how to trade it with an example, its advantages, and disadvantages.
What is the Descending Triangle chart pattern?
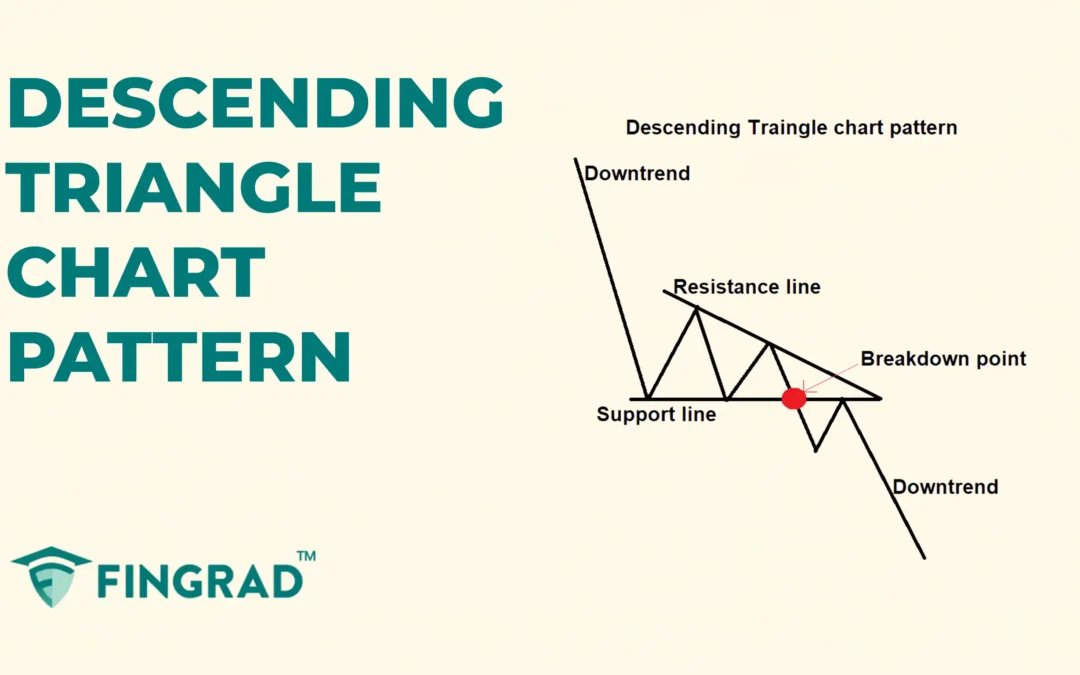
The Descending Triangle pattern is a consolidation pattern formed when the price moves within two converging trendlines before a strong bearish breakout and continuation of the bearish trend. Two converging trendlines define the range; the line above is the resistance line, and the line below is the support line in an ongoing downtrend.
Once this consolidation of the price is over, the price typically breaks down to begin a strong bearish trend after the pattern is formed.
The Descending Triangle pattern can form over days, weeks, or even months, depending on the price action.
Structure
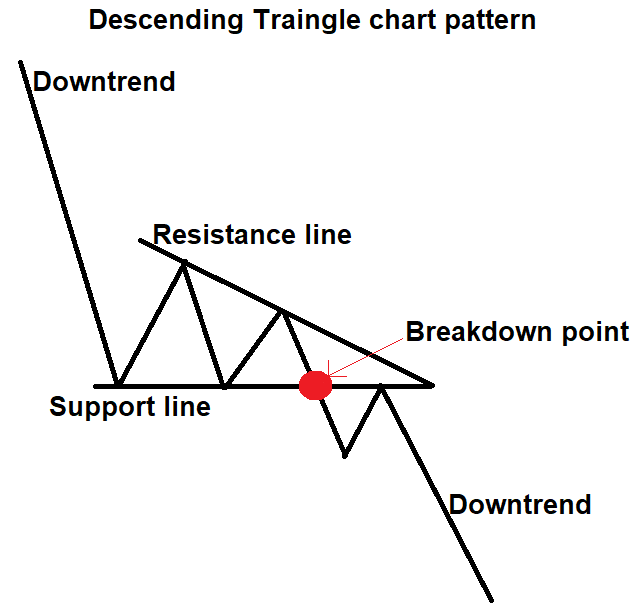
- Converging Trendlines: On the price chart, two trendlines are drawn in an ongoing downtrend.
- Upper trendline (Resistance line): The upper trendline slopes downward, connecting a series of lower highs.
- Lower trendline (Support line): A flat or horizontal line is drawn by connecting a series of similar lows.
The price should touch each trendline at least two to three times for a pattern confirmation.
- Interpretation: After a strong downtrend, the pattern is formed, indicating a bearish continuation pattern, showing that sellers are stepping in aggressively to push the prices to their low.
- Breakout Confirmation: The pattern breakout is confirmed only when the bearish candle closes below the support line of the pattern.
How to identify the Descending Triangle chart pattern?
First, identify a security in a downtrend. Wait for a pullback in the price. As the price forms lower highs, draw two trendlines connecting them, one flat or horizontal support line on the bottom and one descending resistance line above, which converge toward a point, forming a triangle.
When the price is trading within a narrow range, the trading volume decreases, signalling uncertainty in the bearish price action and reduced volatility of the security.
Wait for a breakout candlestick: The pattern is confirmed when the price closes below the support line, and the signal to trade the security in a downward direction.
How to trade the Descending Triangle chart pattern?
Sell signal:
Entry:
- Enter a short position in the security at the candle close which breaks below the support line of the descending triangle chart pattern formed.
Stop-loss:
- At the high of the most recent swing top within the triangle, set the stop-loss.
Target:
- Measure the height of the triangle at its widest point, project that distance from the breakout point, and set the target.
Target Price = Breakout Price – (Height of the Triangle)
- According to your trading strategy, set your target as per your risk-reward ratio of 1:1, 1:2, or higher.
Example:
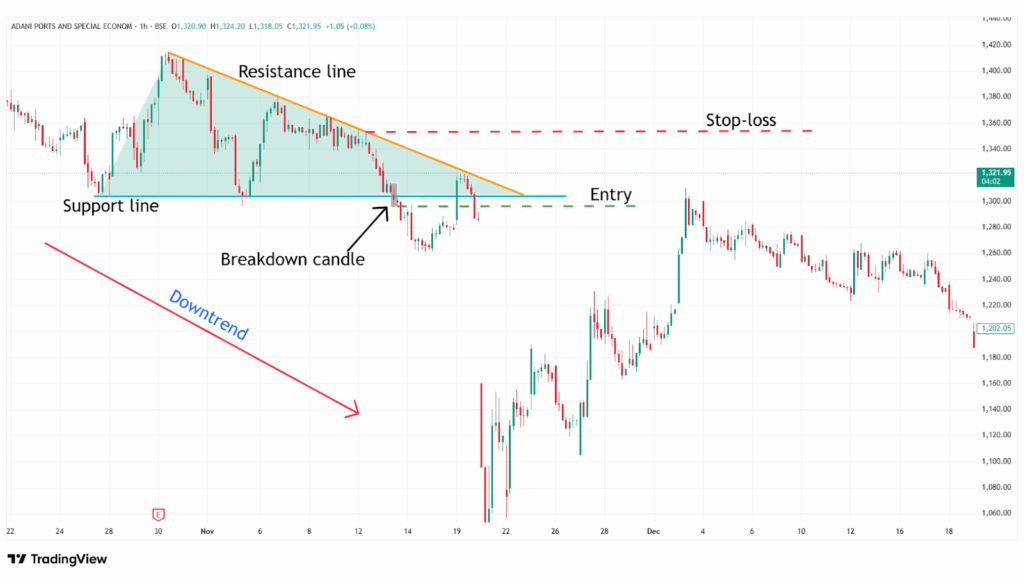
The chart below shows an example of “ Adani Ports Ltd” stock at a 1-hour timeframe from 25th October to 13th November 2024, and you can see the sell signal generated by the Descending Triangle.
What are the advantages of the Descending Triangle chart pattern?
- The Descending Triangle is one of the highly reliable bearish continuation patterns in technical analysis.
- The trendline of the Descending Triangle acts as a strong resistance after the breakout of the pattern.
- The Descending Triangle provides a clear entry, stop-loss, and target for everyone.
- The Descending Triangle is versatile across all timeframes and all other security markets, and as a single strategy, can be applicable for all markets.
What are the disadvantages of the Descending Triangle chart pattern?
- False breakouts can happen in a Descending Triangle when the price moves below the trendline with low volume, and then it quickly reverses, especially during a sideways market.
- By the time the Descending Triangle confirms, much of the move may have already happened.
- The Descending Triangle often takes a long time to develop, especially on higher timeframes.
In Closing
In the article, we learned the Descending Triangle chart pattern, its structure, how to identify the pattern, how to trade it, along with an example of a past pattern formed, its advantages, and disadvantages.
The Descending Triangle chart pattern is a powerful tool that helps traders identify the potential bearish continuation in the ongoing downtrend, indicating multiple opportunities for clear entry and exit signals.
Your profitability depends on your approach to the trade, your risk management, and your mindset when you are holding the trade, as no indicator or tool is 100% accurate, and as the Descending Triangle chart pattern’s efficiency and accuracy increase rapidly when it is combined with additional indicators or tools (RSI, MACD, or others).
