
In Technical analysis, there are chart patterns that are rare to spot, and when spotted, they give a strong directional movement according to the type of the pattern, and one such pattern is the Diamond Top pattern. It is a chart pattern associated with potential bearish reversals after an uptrend, but outcomes and strength vary with context.
In this article, we will discuss the Diamond Top Pattern, its structure, how to identify it, how to trade it with an example, its advantages, and its disadvantages.
What is the Diamond Top Pattern
The Diamond Top Pattern is one of the rarest yet powerful chart patterns, indicating a potential bearish reversal at the top of an uptrend.
The term “Diamond” refers to the diamond-like shape that appears at the peak of a bullish market, and the pattern can form over days, weeks, or even months, depending on the price action.
Once this consolidation of the price is over, the price typically breaks down to begin a strong bearish trend after the pattern is formed, and you can observe the increased volume on the selling side.
Structure
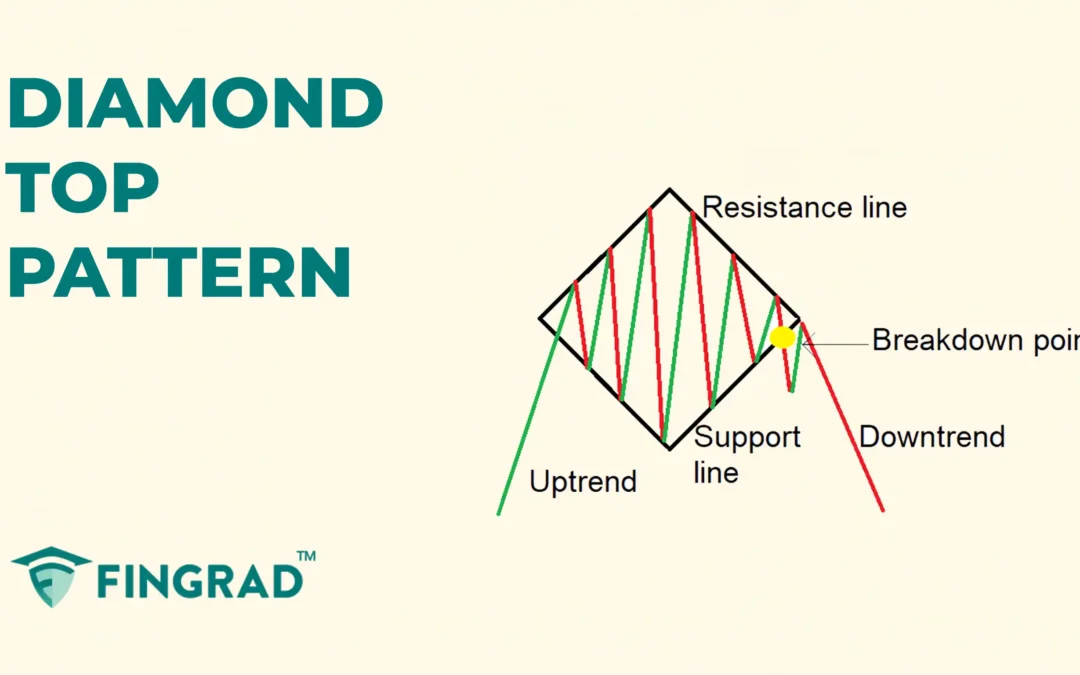
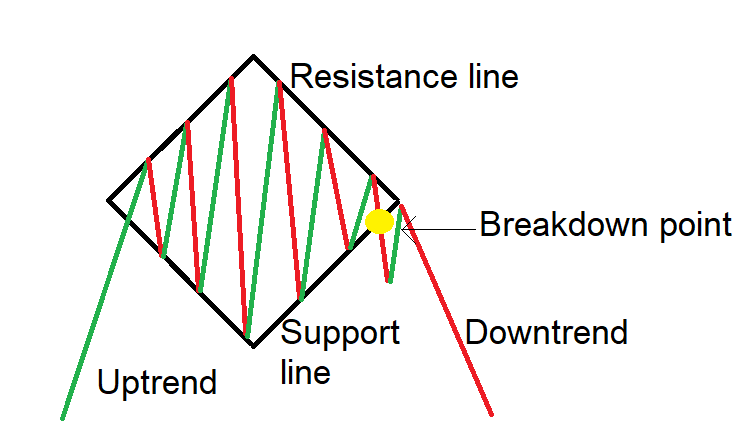
- Diverging and converging Trendlines: On the price chart, four trendlines are drawn, two diverging, followed by two converging in an ongoing uptrend.
- Upper trendline: It is drawn by connecting a series of higher highs, and another line is drawn by connecting the series of lower highs, which acts as a strong resistance line.
- Lower trendline: It is drawn by connecting a series of lower lows, and another line is drawn by connecting the series of higher lows, which acts as a strong support line.
- Breakdown candle: As the bearish candle closes below the support line of the pattern, it is an indication of the pattern’s breakdown.
Together, the wide then narrowing range forms a diamond-like shape.
How to identify the Diamond Top Chart Pattern?
Start by identifying a security in an uptrend. Look for price swings that initially widen on both sides, then gradually narrow, forming the diamond shape on both sides, then draw trendlines connecting them, which diverge toward a start point and converge to the end point, forming a symmetrical triangle and an inverted symmetrical triangle connecting.
As price consolidates, the trading volume tends to increase as the price swings widen, and the trading volume decreases as the price swings become shorter.
Wait for a breakdown: The pattern is confirmed when the bearish candle closes below the support line, signaling a short-selling opportunity.
How to trade the Diamond Top chart pattern?
Sell signal:
Entry:
- Enter a short trade in the security when the price breaks and closes below the diamond top chart pattern formed.
Stop-loss:
- An ideal stop-loss is placed at the high of the most recent swing high within the Diamond Top pattern.
Target:
- Measure the height of the diamond and project it downward from the breakdown point, and set the primary target.
Target = Breakdown Point – (Height of the Diamond)
- Or, according to your trading strategy, place the target on a 1:1, 1:2, or higher risk-reward ratio.
Example:
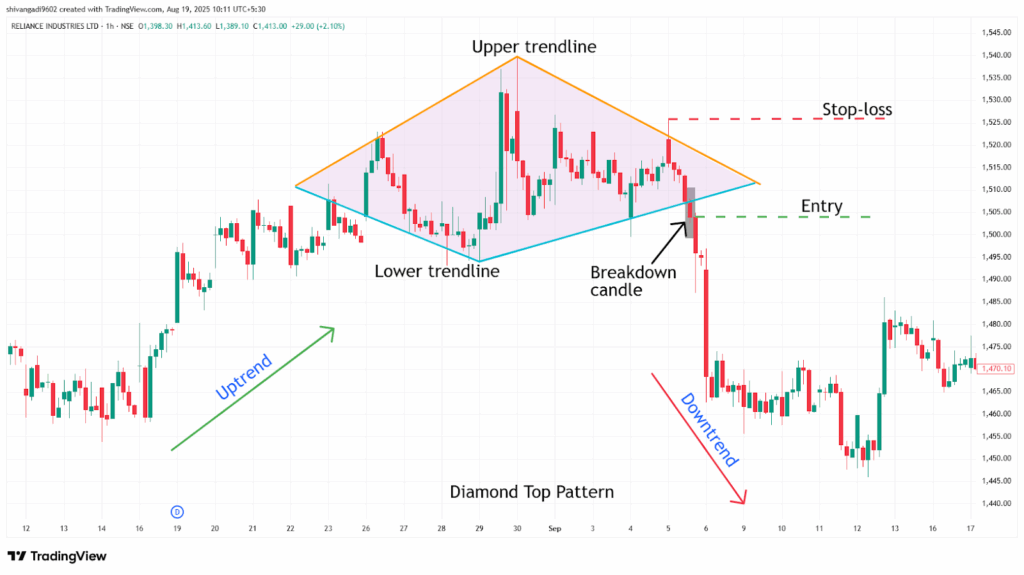
The chart below shows an example of “ RIL Ltd” stock at a 1-hour timeframe from 26th August to 5th September 2024, and you can see the sell signal generated by the Diamond Top Chart pattern.
What are the advantages of the Diamond Top Pattern?
- The Diamond Top Pattern is one of the highly reliable bearish reversal patterns in technical analysis.
- The trendline of the Diamond Top Pattern acts as a strong resistance after the breakdown of the pattern.
- The Diamond Top Pattern provides a clear entry, stop-loss, and target for everyone.
- The Diamond Top Pattern is versatile across all timeframes and all other security markets, as a single strategy can be applicable for all markets.
What are the disadvantages of the Diamond Top Pattern?
- As volatility increases during the Diamond Top pattern formation, it can lead to frequent price swings and false signals, making it hard to trade for beginners.
- The Diamond Top Pattern often takes a long time to develop, especially on higher timeframes.
- When price briefly breaks a boundary on weak participation and then reverses, false breaks can occur in either direction, especially in volatile or choppy conditions.
In Closing
In this article, we learned the Diamond Top Pattern, its structure, how to identify it, how to trade it, along with an example, its advantages, and disadvantages.
The Diamond Top Pattern is a powerful tool used to identify potential bearish reversals in the ongoing uptrend after a consolidation, and it indicates multiple opportunities for clear entry and exit rules that are easy to follow.
Your profitability depends on your approach to the trade, your risk management, and your mindset when you are holding the trade, as no indicator or tool is 100% accurate, and when the Diamond Top Pattern is combined with additional indicators or tools (RSI, MACD, or others), its efficiency and accuracy increase rapidly.
