
If your trading is based on technical analysis, you’ve likely encountered powerful candlestick patterns that help identify potential trend reversals, making it easier to trade securities. Among the most reliable bullish reversal patterns is the Double Bottom chart pattern, especially during the market’s transition from an ongoing downtrend to an uptrend.
In this article, we will understand the Double Bottom Chart Pattern, its structure, how to identify it, how to trade it with an example, its advantages, and disadvantages.
How to trade the Double Bottom Chart Patterns?
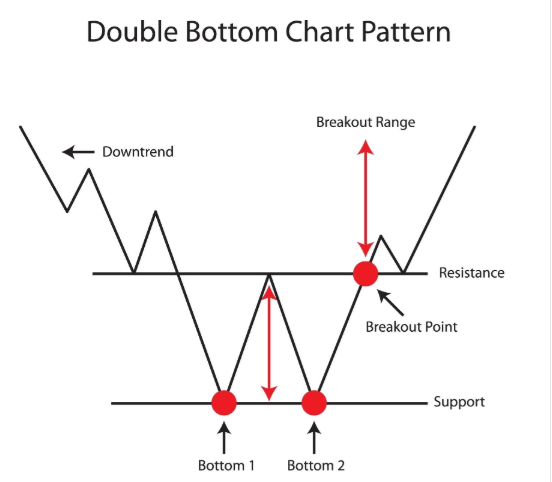
The Double Bottom pattern indicates a strong bullish reversal, formed after a downtrend, and resembles the letter “W”, indicating a shift in market sentiment from bearish to bullish.
The Double Bottom pattern can be formed over days, weeks, or even months, depending on price action.
Once this consolidation of the price is over, the price typically breaks out to begin a strong bullish trend.
Structure
1. Two Distinct Lows: On the price chart, the price forms two separate bottoms that are roughly equal in price.
2. Neckline: It is a resistance line drawn horizontally or slightly sloped by connecting the peak points between the two bottoms.
3. Breakout Confirmation: As the bullish candle closes above the neckline, the pattern is considered confirmed, and you can plan for an entry.
How to identify the Double Bottom Chart Pattern?
Spot the security trading in a downtrend, look for the two bottom formations resembling the “W” letter at any timeframe. Then draw the horizontal trendline by connecting the peak points between the bottom, which often act as key resistance levels called the neckline.
Wait for a breakout candlestick: The formation of a confirmed breakout candle above the neckline is your signal to trade the security in an upward direction.
Calculate the target: Calculate the Height of the Pattern and project the height upward from the Neckline.
How to trade the Double Bottom Chart Pattern?
Entry:
- As the price breaks and closes above the neckline. Enter the long position trade on the next candle.
Stop-loss:
- Place a stop-loss at the low of the second bottom.
Target:
- Calculate the target using the equation below and place it as the primary target.
Target Price = Neckline Price + Pattern Height
- Or set your primary target according to your risk-reward ratio.
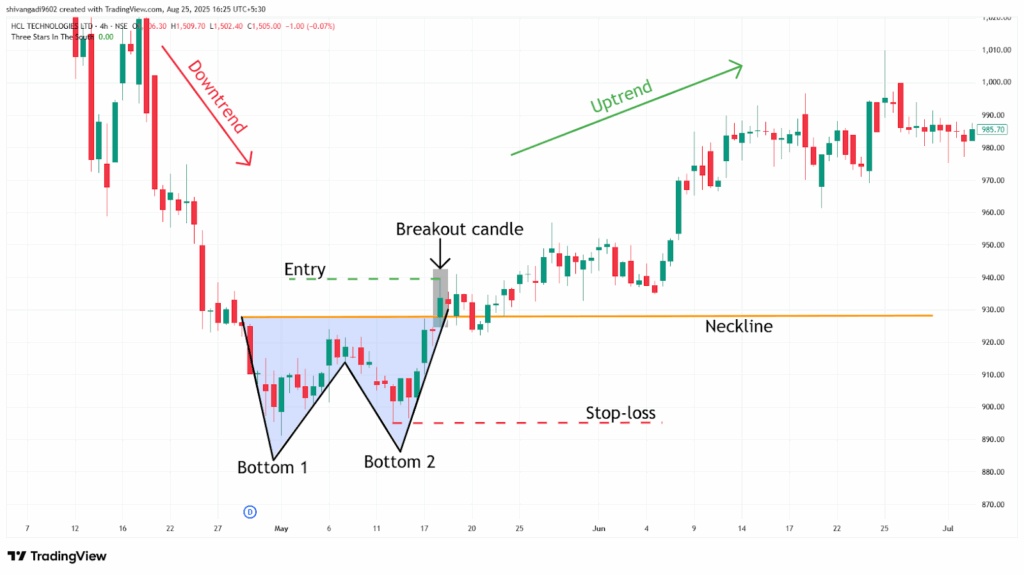
Example:
In the image below, you refer to the chart of the “ HCL Technologies Ltd” stock at a 4-hour timeframe from 28th April to 18th May 2021, and you can see the buy signal generated by the Double Bottom chart pattern.
What are the advantages of the Double Bottom pattern?
- The Double Bottom pattern is one of the highly reliable bullish reversal patterns in technical analysis.
- The Double Bottom pattern provides a clear entry, exit, and target to trade for everyone.
- The Double Bottom pattern is versatile across all timeframes and all other security markets, as a single strategy can be applicable for all markets.
- The neckline of the Double Bottom pattern acts as a strong support after the breakout of the pattern.
What are the disadvantages of the Double Bottom pattern?
- The Double Bottom pattern is hard to identify, especially during volatile market conditions.
- Due to a lack of volume in a sideways market, the pattern is hard to trade and often results in a false signal.
- By the time the Double Bottom pattern confirms, much of the move may have already happened.
- The Double Bottom pattern often takes a long time to develop, especially on higher timeframes.
In Closing
In this article, we explored the Double Bottom pattern, its structure, how to identify the pattern, how to trade it, along with an example, its advantages, and disadvantages.
The Double Bottom pattern is a powerful tool that signals potential bullish reversals in the ongoing downtrend, and it indicates multiple opportunities for clear entry and exit signals.
Your profitability depends on your approach to the trade, your risk management, and your mindset when you are holding the trade, as no indicator or tool is 100% accurate, and when the Double Bottom pattern is combined with additional indicators or tools (RSI, MACD, or others), its efficiency and accuracy increase rapidly.
