
In technical analysis, chart patterns play a crucial role in helping traders identify shifts in market trends and make informed trading decisions. These formations reflect the battle between buyers and sellers and often provide early signals of potential reversals or continuations. One such well-known bearish reversal formation is the Double Top pattern, which signals weakness in an uptrend and the possibility of a downward move.
In this article, we will discuss the Double Top Chart Pattern, its structure, how to identify it, how to trade it with an example, its advantages, and disadvantages.
How to trade the Double Top Chart Patterns?
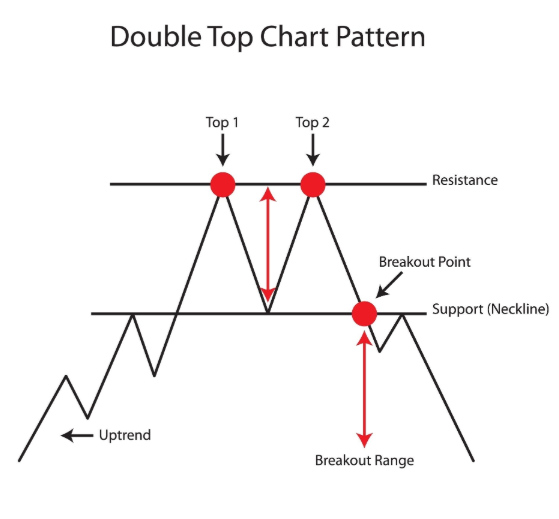
The Double Top chart pattern indicates a strong bearish reversal resembling the letter “M,” after a strong uptrend, and indicates a shift in market sentiment from bullish to bearish trend.
The Double Top pattern can form over days, weeks, or even months, depending on price action.
Once this consolidation of the price is over, the price typically breaks down to begin a strong bearish trend.
Structure
1. Two Distinct highs: On the price chart, the price forms two separate highs that are roughly equal in price.
2. Neckline: It is a support line drawn horizontally or slightly sloped by connecting the low points between the two tops.
3. Breakout Confirmation: As the bearish candle closes below the neckline, the pattern is considered confirmed, and you can plan for an entry.
How to identify the Double Top Chart Pattern?
Spot the security trading in an uptrend, look for the two top formations resembling the “M” letter at any timeframe. Then draw the horizontal trendline by connecting the low points between the bottom, which often act as key support levels called the neckline.
Wait for a breakout candlestick: The formation of a confirmed breakdown candle below the neckline is your signal to trade the security in a downward direction.
Calculate the target: Measure the Height of the Pattern and project the height downward from the Neckline.
How to trade the Double Top Chart Pattern?
Entry:
- As the price breaks and closes below the neckline. Enter the short trade on the next candle.
Stop-loss:
- Place a stop-loss at the high of the second top.
Target:
- Calculate the target using the equation below and place it as the primary target.
Target Price = Neckline Level − (Height of the Pattern)
- Or set your target according to your risk-reward ratio.
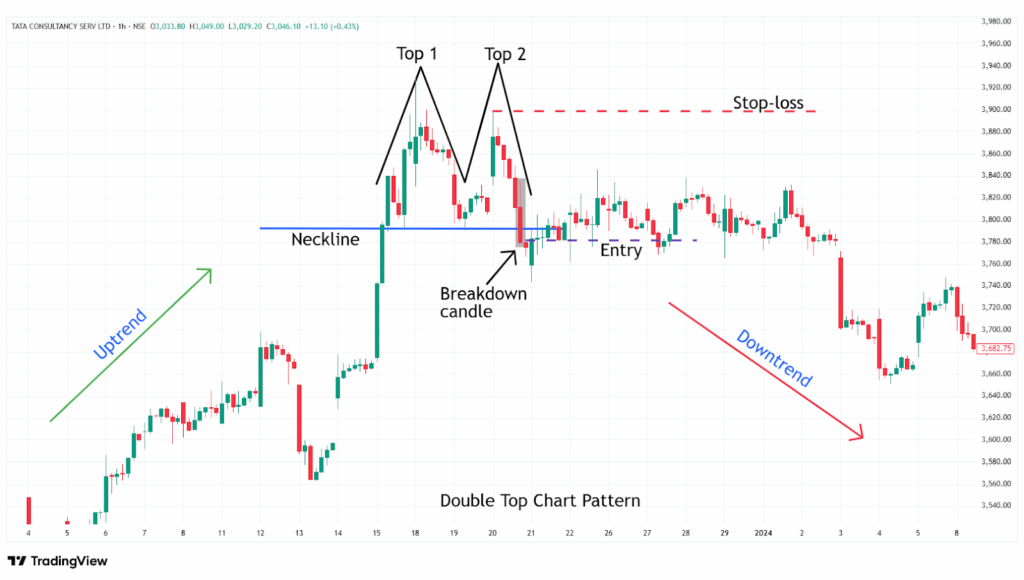
Example:
In the image below, you refer to the chart of the “ TCS Ltd” stock at a 1-hour timeframe from 15th to 20th December 2023, and you can see the sell signal generated by the Double Top chart pattern.
What are the advantages of the Double Top pattern?
- The Double Top pattern is one of the highly reliable bearish reversal patterns in technical analysis.
- The Double Top pattern provides a clear entry, exit, and target to trade for everyone.
- The Double Top pattern is versatile across all timeframes and all other security markets, as a single strategy can be applicable for all markets.
- The neckline of the Double Top pattern acts as a strong resistance after the breakout of the pattern.
What are the disadvantages of the Double Top pattern?
- The Double Top pattern is hard to identify, especially during volatile market conditions.
- In a sideways market with low volume, the price may break below the neckline prematurely, leading to a quick reversal and a false breakout before the Double Top pattern is fully confirmed.
- By the time the Double Top pattern is confirmed, much of the move may have already happened.
- The Double Top pattern often takes a long time to develop, especially on higher timeframes.
In Closing
In this article, we discussed the Double Top pattern, its structure, how to identify the pattern, how to trade it, along with an example, its advantages, and disadvantages.
The Double Top pattern is a powerful tool that signals potential bearish reversals in the ongoing uptrend, and it indicates multiple opportunities for clear entry and exit signals.
Your profitability depends on your approach to the trade, your risk management, and your mindset when you are holding the trade, as no indicator or tool is 100% accurate, and when the Double Top pattern is combined with additional indicators or tools (RSI, MACD, or others), its efficiency and accuracy increase rapidly.
