
In all financial markets, candlesticks display the sentiment of the price action and the strength of buyers and sellers. When the strength between the buyer and seller is matched, the Doji candlestick is formed. In this article, we will discuss one of the Doji candlestick patterns.
In this article, we will explore Dragonfly Doji Candlestick Patterns, their structure, how to trade them with an example scenario, and the psychological pattern behind the candlestick, along with its advantages and disadvantages.
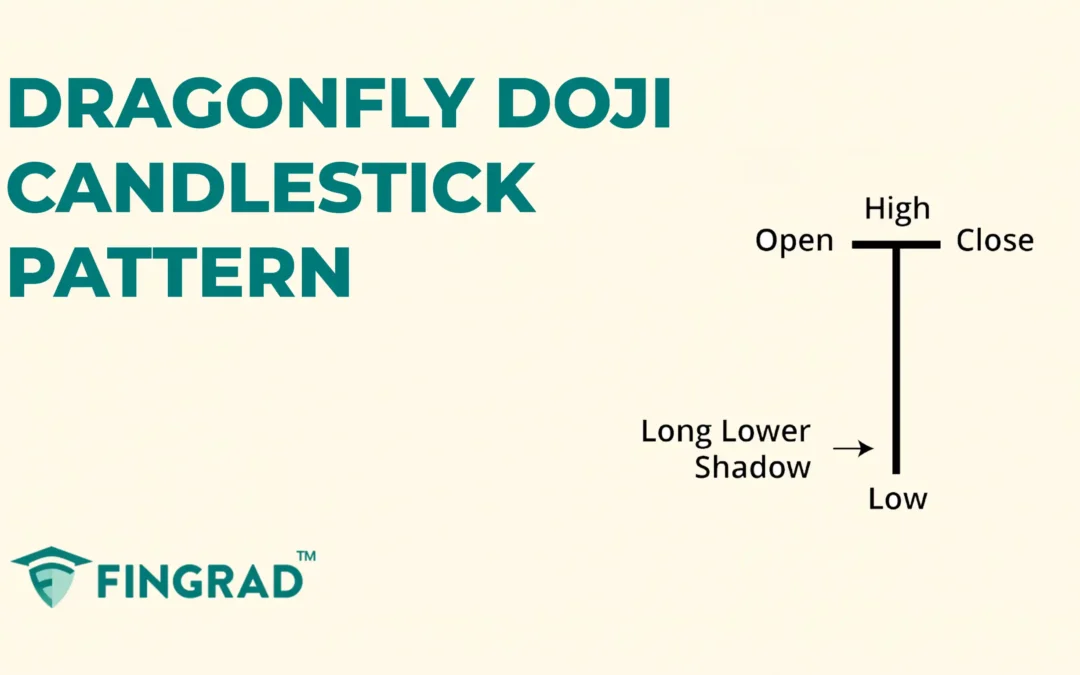
What is the Dragonfly Doji Candlestick Pattern?
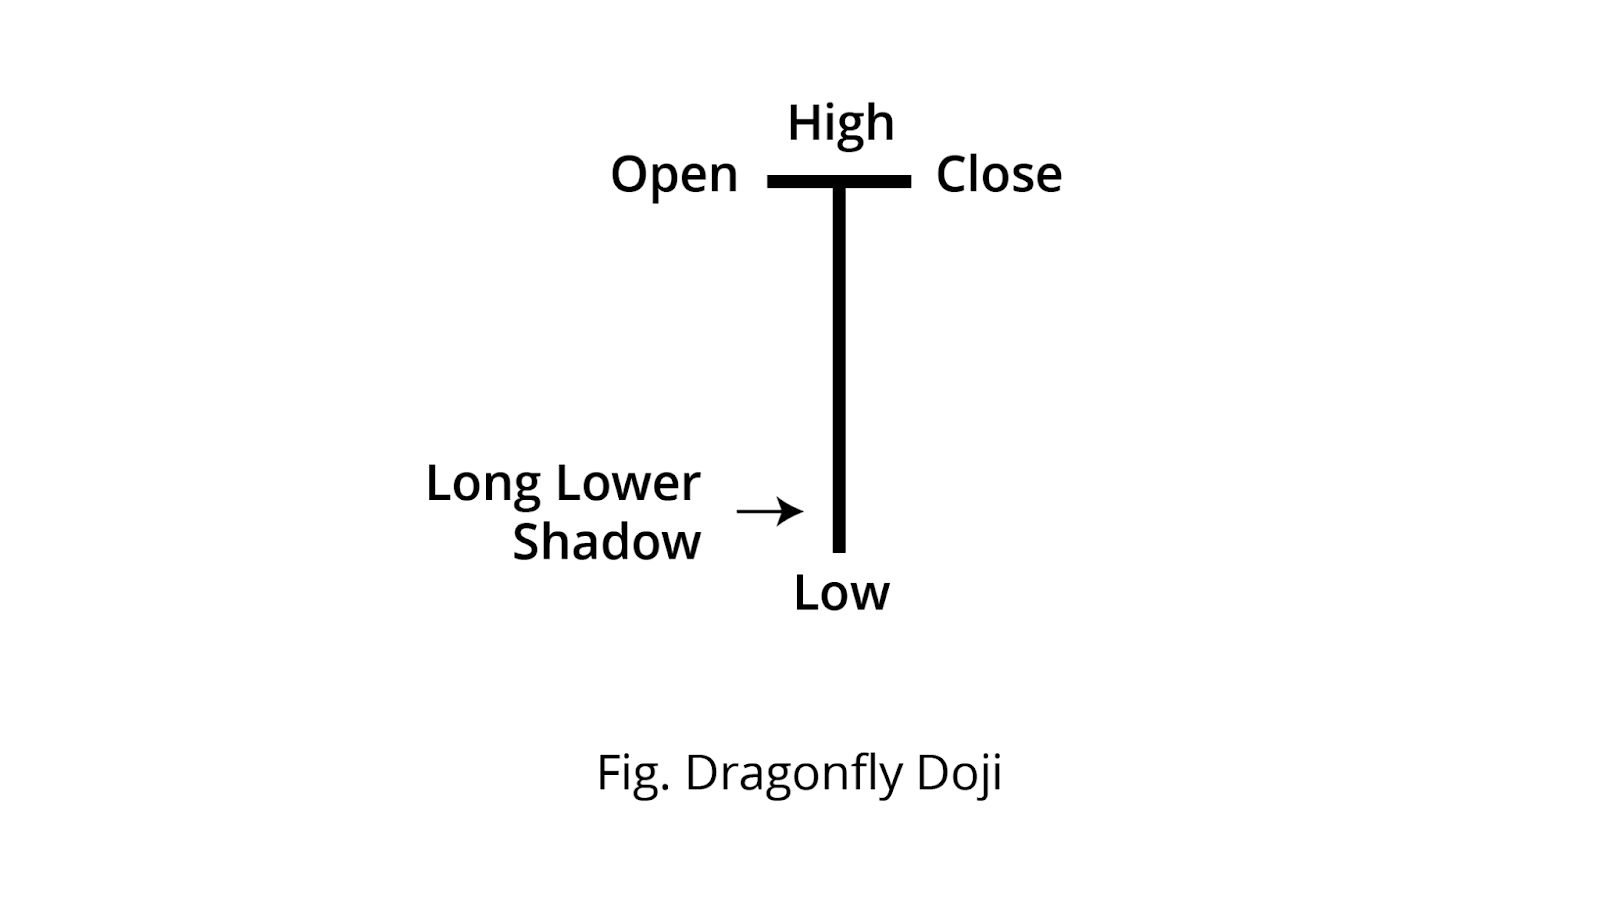
The Dragonfly Doji Candlesticks pattern is a single-candlestick formation. It indicates a potential bullish reversal in an ongoing downtrend and signals uncertainty and a change in the market trend.
The Dragonfly Doji Candlestick is formed when the strength of buyers and sellers is balanced, indicating no clear trend control.
Structure
The Dragonfly Doji candlestick is spotted at the bottom of the downtrend.
- A Dragonfly Doji candlestick has an extremely small or non-existent real body, indicating that the opening and closing prices for the period are nearly identical.
- The long lower shadow/wick that is typically at least twice the length of the body and has little to no upper shadow or wick.
The Dragonfly Doji candlestick psychological pattern
- In a downtrend, the sellers push the price down, and then buyers step in aggressively to push the price up. At the same time, sellers also defend higher price levels and create a balance of pressure, and the price closes very near its opening, forming a long lower wick resulting in a Dragonfly Doji candlestick.
- Rejection of the low points: The prominent lower shadow shows rejection of lower prices; minimal upper shadow indicates buyers regained control into the close.
- Indecision Closing: The price closes near its opening, indicating a lack of confirmation to signal the upcoming direction of the trend.
How to trade a Dragonfly Doji candlestick pattern
The Dragonfly Doji candlestick is versatile across all the frames. In the lower timeframe, it is often spotted, making it hard to trade.
The candle after a dragonfly doji may confirm direction if it breaks decisively, but strong follow‑through is not guaranteed.
Buy Signal:
Entry:
- As the next candle closes above the high of the Dragonfly Doji candlestick with a strong bullish candlestick, plan a trade for an upward direction.
Stop-loss:
- The stop-loss for the trade is the low of the Dragonfly Doji candlestick.
Target:
- An ideal target is the next resistance line. According to your risk management, target for a risk-reward of at least 1:1, ideally 1:2 or more.
Example:
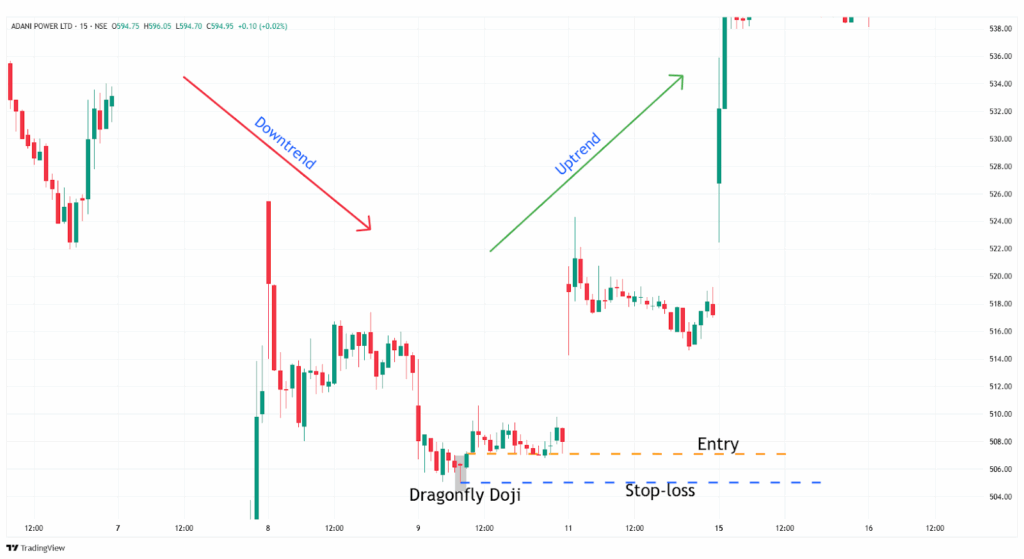
When you look at the image below, the chart of “ Adani Power Ltd” stock at a 15-minute timeframe on 9th April 2025. You can spot the Dragonfly Doji candlestick followed by a bullish candlestick for confirmation of an uptrend ahead.
What are the advantages of the Dragonfly Doji Candlestick Pattern?
- The follow-up candlestick after the Dragonfly Doji pattern provides a clear understanding of the trend and identifies optimal entry and exit points.
- It is recognizable in form, but correct contextual use and confirmation are important for effective trading.
- It provides good risk management while trading. With a minimal stop-loss, you can capture the whole trend.
- According to the direction of the trade, the pattern high or low can be used as a strong resistance or support level.
What are the disadvantages of the Dragonfly Doji Candlestick Pattern?
- At a lower timeframe, it is often spotted, making it hard to identify the actual trend reversal.
- In a sideways market, due to a lack of volume, the reversal might be a false signal.
- The upcoming trend is dependent on the follow-up candlestick.
- The pattern signals the trend reversal, but does not provide the strength of the trend.
In Closing
In this article, we covered the Dragonfly Doji candlestick pattern, its structure, the psychology of the pattern, how to trade it with an example, and its advantages and disadvantages.
Dragonfly Doji candlestick is a powerful single-candlestick pattern that displays the uncertainty in the security price action, resulting in a lead and lag of the price action according to the trend, and the candlestick pattern offers multiple opportunities for beginners with clear entry and exit signals, making it an accessible pattern.
No indicator or tool in the financial markets is 100% accurate. When the Dragonfly Doji candlestick pattern is combined with additional indicators or tools, the efficiency and accuracy are high, and with proper risk management and discipline can pave the path to profitability.
