
Candlestick patterns are essential tools in technical analysis that help clarify the price action of a security. One such pattern is the Evening Star Pattern, known for its reliability and effectiveness. This three-candle formation offers greater accuracy in trading decisions.
In this article, we shall understand what the evening star pattern is, its structure, the psychology behind the pattern, how to trade with an example, its key characteristics, and a comparison between the morning star and the evening star candlestick patterns.
What is the Evening Star Pattern?
The name ‘Evening Star’ symbolizes the end of the ‘day’ (or bull market) and the start of a night. The Evening Star Candlestick pattern is a three-candlestick formation signalling the change in the potential trend from an uptrend to a downtrend.
The patterns suggest that the buyers are losing control and the sellers are taking over, which would result in an entry to the short position by traders in a security.
Structure
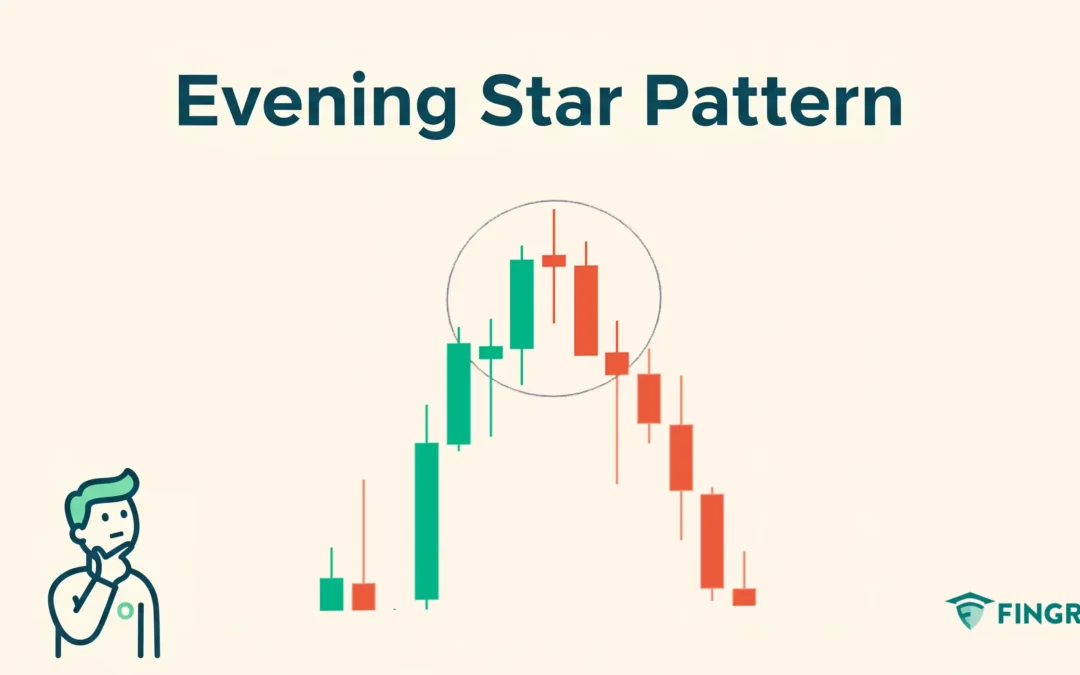
It is mainly a bearish reversal pattern that is spotted at the top of an uptrend market.
First Candle: It is usually a large bullish candle that confirms strong buying in the market.
Second Candle: A small-bodied candlestick signaling indecision of the price in the security, with upper and lower wicks displaying the price action.
Third candle: It is a strong bearish candle, signaling the trend reversal, and it is the confirmation of the change in direction from bullish to bearish.

Psychology Behind the Evening Star Candlestick Pattern
- Bullish Candlestick: At the current uptrend of the security, the buyers are dominant, driving the price to its high, indicating further upward movement.
- Indecision candlestick: As the second candlestick opens, buyers drive the price high, as the price is at the top, the sellers see an opportunity and step in to push the price down, forming a long upper wick. The buyers defend the low to resist the downward momentum by matching the seller’s strength, forming a small lower wick, resulting in an indecision candlestick as the opening and closing of the second candlestick are the same or with a little difference.
- Bearish Candlestick and Trend Reversal: After the closing of the second candlestick, sellers step in aggressively, driving the price low and indicating a strong downtrend ahead, resulting in a strong bearish candlestick and confirming the trend reversal from an uptrend to a downtrend.
How to trade the Evening Star candlestick Pattern?
After spotting the morning star pattern, wait for the confirmation.
Entry:
- After the formation of the evening star candlestick pattern, an entry to the short position in the security can be placed at the close of the third candle formed of the pattern.
Stop-loss:
- The stop loss for the short position can be placed at the high of the pattern formation.
Target:
- The initial target is the next support line, from where the buyers can step in to resist the downward movement.
- If there is any candlestick signaling a reversal after confirmation, or according to your risk-reward ratio of 1:1 or 1:2, you can plan for exit.
Example Scenario:
In the image below, you can look at the chart of “INFOSYS Ltd” stock at a 1-hour timeframe on 15th October 2024. You can see the sell signal generated by the Evening Star candlestick as it is a trend reversal.

What are the Key Characteristics?
- The Context on Trend: It should be formed at the top of the price chart in an ongoing uptrend.
- Volume indication: As a confirmation candlestick is formed, the increased volume adds confidence to the trade, and adds strength to the bearish reversal.
- Confirmation: As the majority of traders look for confirmation, the third candle in the pattern acts as a confirmation of the execution of the trade.
Comparing Morning Star vs Evening Star
| Morning Star | Evening Star |
| Bullish: It indicates the change in the trend from bearish to bullish. | Bearish: It indicates the change in the trend from bullish to bearish. |
| Chart placement: When the market is heading towards the lower limits, Morning Star forms at the bottom. | Chart placement: When the market is heading toward the higher limits, the Evening Star forms at the top. |
| Indecision Candle: The small middle candle signals market indecision and a strong fight between buyers and sellers to control the trend, as the buyers are strong. | Indecision Candle: The small middle candle signals market indecision and a strong fight between buyers and sellers to control the trend; in the end, sellers are strong. |
| Confirmation candle: A strong bullish third candle confirms a buyer’s takeover and the reversal of the trend. | Confirmation candle: A strong bullish third candle confirms a seller’s takeover and the reversal of the trend. |
In Closing
In this article, we came across what the evening star candlestick pattern is, its structure, the psychology of the pattern, how to trade it with an example, and the key characteristics, along with a comparison of the morning star and evening star candlestick patterns.
Evening Star is one of the versatile and efficient tools when it comes to technical analysis for beginners starting to learn the market. Evening Star aims to identify the important reversal point to trade or make a position for the long term. As the accuracy varies from 50% to 60% it depends on how well you back tested it and how strong your risk management and your mindset are while the trade is open.
Across the financial markets all over the world, no indicator or tool is 100% accurate. When the Evening Star candlestick pattern is combined with additional indicators or tools, its efficiency and accuracy are high, and with proper risk management, discipline, and back testing of the strategy, it can pave the path to profitability.
