
In technical analysis, traders use a variety of tools and patterns to analyse price movement and have a huge impact on the price, provide a clear understanding of the price sentiment, and help identify the optimal entry and exit points during the trade. In the article below, we will discuss one of the chart patterns.
In this article, we will understand the Exhaustion Gap Pattern, its structure, how to identify it, how to trade it with an example, its advantages, and disadvantages.
What is the Exhaustion Gap Pattern?
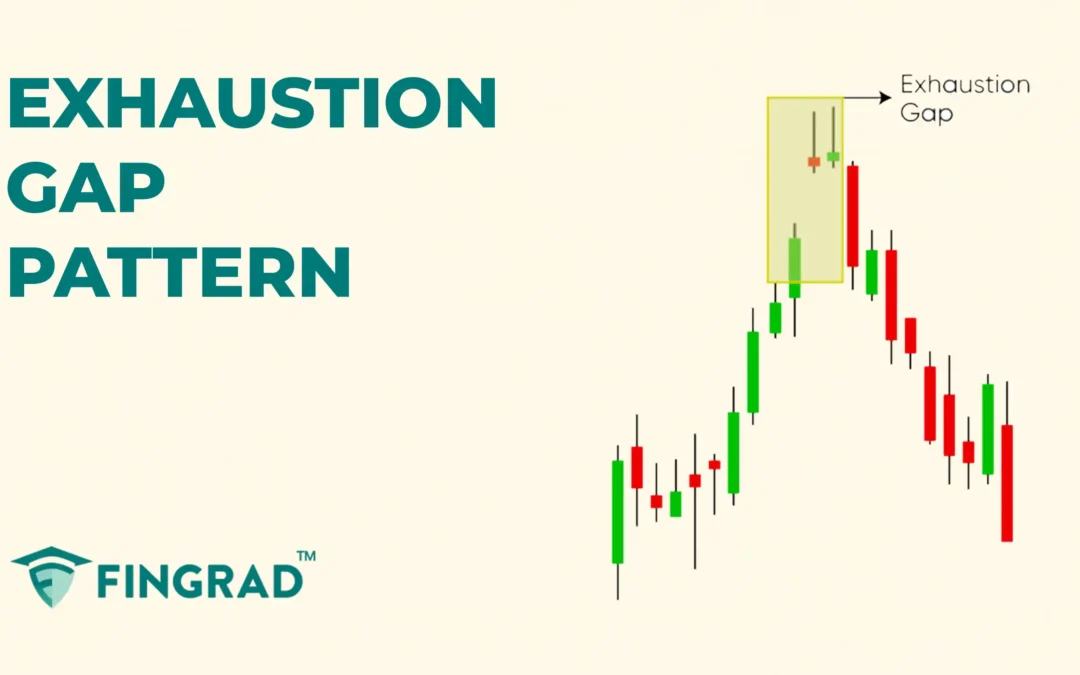
The Exhaustion Gap Pattern occurs at the end of the ongoing trend, displaying the exhaustion of the buyer or seller according to the trend, indicating the end of the trend, followed by a reversal or consolidation.
In the pattern, the price jumps or falls sharply, creating a noticeable gap on the chart, and unlike other gaps (like breakaway or runaway gaps), exhaustion gaps typically appear after an extended trend and serve as a warning sign that the momentum is fading and the price may soon change direction.
Structure:
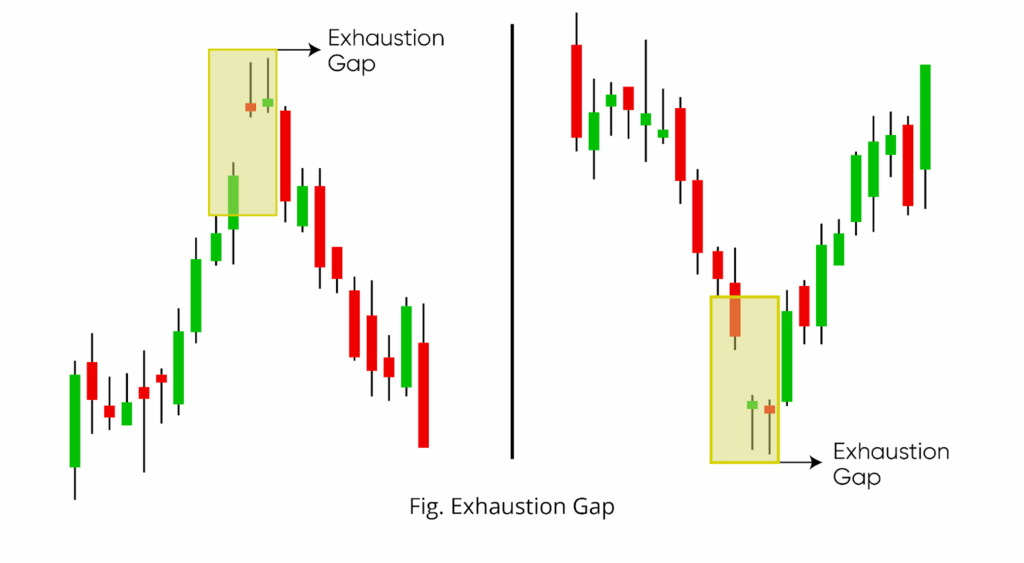
- Strong trend: Initially, the security is trading in a strong uptrend or downtrend one party dominating the trend.
- Gap: The session opens with a price jump that leaves a gap away from the prior close, upward gaps in uptrends, and downward gaps in downtrends.
- Reversal in the pattern: After the gap, the price fails to continue in the same direction due to exhaustion from moving the price, and starts to reverse or move sideways.
How to identify the Exhaustion Gap Pattern?
Bullish Signal:
- First, identify a security in a downtrend, then look for a gap where the opening price is significantly above the previous day’s close. You can see the high trading volume on the gap day, signalling intense but potentially final interest. Wait for price failure to continue the trend after the gap.
- As the following candles fail to continue the trend, wait for the bullish candle to close above the resistance line or the gap, the pattern is confirmed, then plan for a long trade.
Bearish Signal:
- First, identify a security in an uptrend, then look gap where the opening price is significantly below the previous day’s close. You can see the high trading volume on the gap day, signalling intense but potentially final interest. Wait for price failure to continue the trend after the gap.
- As the following candles fail to continue the trend, wait for the bearish candle to close below the support line or the gap, the pattern is confirmed, then plan for a short trade.
How to trade the Exhaustion Gap Pattern?
After confirmation of price reversal, follow the gap plan the trade accordingly.
Buy signal:
Entry:
- Consider entering a long position on a bullish close reclaiming the gap zone or clearing nearby resistance, or on a successful retest that holds above it.
Stop-loss:
- Place the stop-loss at the low of the most recent swing low.
Target:
- Set the primary target to the next resistance line.
- Or set based on your preferred risk-reward ratio, depending on your trading strategy.
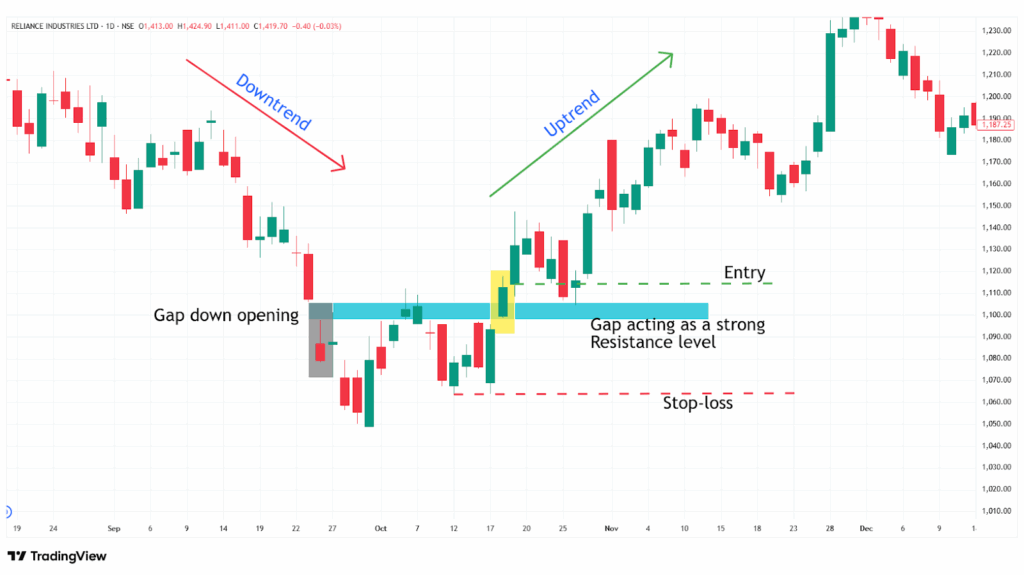
Example:
The chart below shows an example of “RIL Ltd” stock at a 1-day timeframe from 30th September to 18th October 2022, and you can see the buy signal generated by the Exhaustion Gap pattern, as after the gap-down opening, the price fails to continue the downtrend, and a reversal is indicated.
Sell signal:
Entry:
- Plan for a short position as a strong bearish candle closes below the gap or breaks a nearby support level.
Stop-loss:
- Set the stop-loss at the high of the most recent swing top.
Target:
- Set the primary target to the next support line.
- Or set based on your preferred risk-reward ratio, depending on your trading strategy.
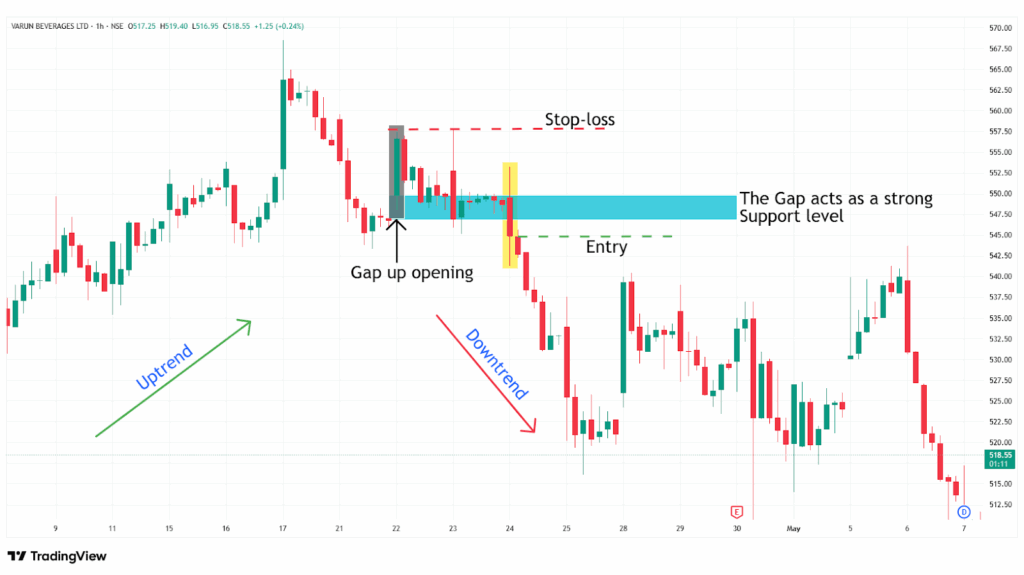
Example:
The chart below shows an example of “Varun Beverages Ltd” stock at a 1-hour timeframe from 22nd to 24th April 2025, and you can see the sell signal generated by the Exhaustion Gap pattern, as after the gap-up opening, the price rises to continue the uptrend, and a reversal is indicated.
What are the advantages of the Exhaustion Gap pattern?
- The Exhaustion Gap pattern is versatile and implemented across all timeframes and markets.
- The Exhaustion Gap pattern displays a clear understanding of the price action and provides optimal entry, stop-loss, and target levels.
- The Exhaustion Gap pattern acts as a strong resistance level after the breakdown of the pattern and a strong support level after the breakout.
- While trading the Exhaustion Gap pattern, the depth of the pattern helps in calculating target levels after a breakout.
The disadvantages of the Exhaustion Gap pattern:
- A false signal can occur in an Exhaustion Gap pattern, and the price can quickly reverse again, especially in low-volume or sideways market conditions.
- Exhaustion gaps form quickly, but confirmation and subsequent reversals can take time to develop, particularly on higher timeframes.
- By the time the Exhaustion Gap pattern confirms, much of the move may have already happened, which affects your risk-reward ratio.
In Closing
In this article, we learned the Exhaustion Gap pattern, its structure, how to identify it, how to trade it, along with an example, its advantages, and disadvantages.
The Exhaustion Gap pattern is a powerful tool that signals the potential reversal in the ongoing trend, indicating multiple opportunities for clear entry and exit signals.
Your profitability depends on your approach to the trade, your risk management, and your mindset when you are holding the trade, as no indicator or tool is 100% accurate in financial market across the world, and as the Exhaustion Gap pattern’s efficiency and accuracy increase rapidly when it is combined with additional indicators or tools (RSI, MACD, or others), and traders should backtest this pattern on various timeframes and instruments to better understand its strengths and limitations.
