
When you begin trading or investing, you may not be able to identify or enter the potential trades due to various scenarios, a lack of confidence in the trade, a lack of risk management, or, in some cases, you might be slow to react to a trade opportunity. To identify potential candlestick patterns for re-entry in a downtrend of the security, the Falling Window pattern has a huge impact in identifying such trend continuation.
In this article, we will discuss the Falling Window candlestick pattern, its structure, and how to trade it, along with the candlestick psychological pattern, an example of a trade scenario, and its advantages and disadvantages.
What is the Falling Window candlestick pattern?
The Falling Window is a two-candlestick formation that signals a strong bearish trend continuation of the existing movement in a downward direction.
The term “Falling” signals a bearish move, and “Window” signals a gap-down in the price, indicating that sellers are in full control and pushing prices to lower levels, and providing valuable insight into the market. And it is simple, easy to understand, and beginner-friendly.
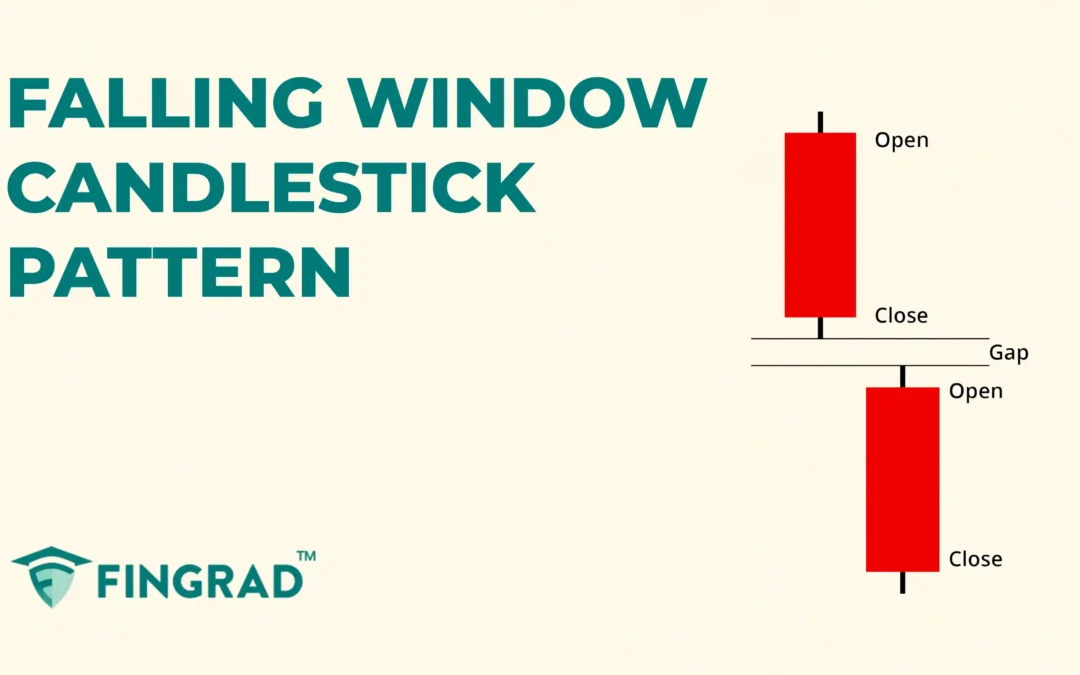
Structure
It is spotted in the middle of a downtrend.
- First candlestick: A bearish candlestick, indicating that sellers are in control of the trend.
- Price Gap-down: There’s a gap down between the first and second candlesticks. The gap displays the selling pressure on the security.
- Second candlestick: A strong bearish candlestick that opens below the low of the first candlestick.

Psychology Behind the Pattern
- Sellers push down: The candlestick pattern is spotted within an ongoing downtrend. The first candlestick of the pattern is bearish, displaying the downward trend.
- Gap-down: A visible “gap” is displayed between the candlesticks, as the second candlestick opens below the low of the first candlestick, and the gap between the prices acts as a strong resistance level for further price action.
- Closing low: Sellers are aggressively pushing the price down, as buyers step in against the trend to push it back up, but sellers aggressively push the price back down, displaying full control over the trend and signaling the continuation of the downtrend. The candlestick closes below the previous low.
How to trade the Falling Window Candlesticks pattern?
When you are trading using candlestick patterns, it is always recommended to wait for a confirmation candlestick.
In the Falling Window candlesticks pattern, the third candlestick confirms the upcoming downtrend.
Entry:
- Enter a short position in the security at the close of the next candle after the formation of the falling window candlestick pattern.
Stop-loss:
- The stop loss for the trade can be placed at the high of the pattern formed.
Target:
- The primary target for the Falling Window candlestick pattern is the next resistance line.
- As per your risk-reward ratio of 1:1 or 1:2, the primary target can vary.
- If you spot a candlestick formation signalling a potential reversal, you can plan for an exit.
Example:
In the image below, you can look at the chart of “HCL Technologies Ltd” stock at a 1-hour timeframe on 21st and 24th February 2025. You can see the sell signal generated using the Falling Window candlestick, as a downtrend continues.

What are the advantages of the Falling Window candlestick?
- The candlestick pattern provides a clear understanding of price action in a downtrend, making it easy to spot and trade.
- The gap-down acts as a strong resistance level for further price action.
- The candlestick pattern provides a strong indication of the continuation of a downtrend.
- It is versatile across all timeframes.
What are the disadvantages of the Falling Window candlestick?
- The candlestick pattern lacks confirmation within the pattern. It is dependent on the following candlestick.
- In a sideways market scenario, due to a lack of volume, the candlestick pattern can result in a false signal.
- During quarterly results, global economic news, or other events, due to high volatility, it lacks efficiency and accuracy.
- It’s not possible to capture the entire downtrend, as a large portion of the downtrend is already over.
In Closing
In the above article, we covered the Falling Window candlestick pattern, its structure, how to trade it, with the candlestick psychological pattern, an example of a trade scenario, and its advantages and disadvantages.
In the end, the Falling Window is a powerful bearish candlestick leading the price action and signals the continuation of a downtrend, making it more efficient, and with proper risk management, discipline can pave the path to profitability. The falling Window Pattern indicates multiple opportunities for clear entry and exit signals.
No indicator or tool is 100% accurate in the financial markets. When combined with additional indicators or tools, the efficiency and accuracy are improved.
