
Technical analysis involves tools and indicators to develop trading strategies. Among such powerful tools that are easy to spot and trade and a single candlestick capable of changing trends is a single candlestick pattern. Understanding these patterns provides a clear understanding of finding optimal entry and exit points. One among such patterns is the Hammer candlestick.
In this article, we will understand what the Hammer Candlestick Pattern is, its structure, how to trade it with an example, and the pattern psychology, along with its advantages and disadvantages.
What is the Hammer Candlestick Pattern?
The Hammer Candlestick is a single candlestick pattern indicating a potential bullish reversal signal in technical analysis. It displays a strong change in the trend, helping you spot optimal entry and exit points while trading.
As the hammer candlestick pattern suggests a bullish trend in the upcoming trading sessions, traders can plan to enter a long position in the security to benefit from the upward price direction.
Structure
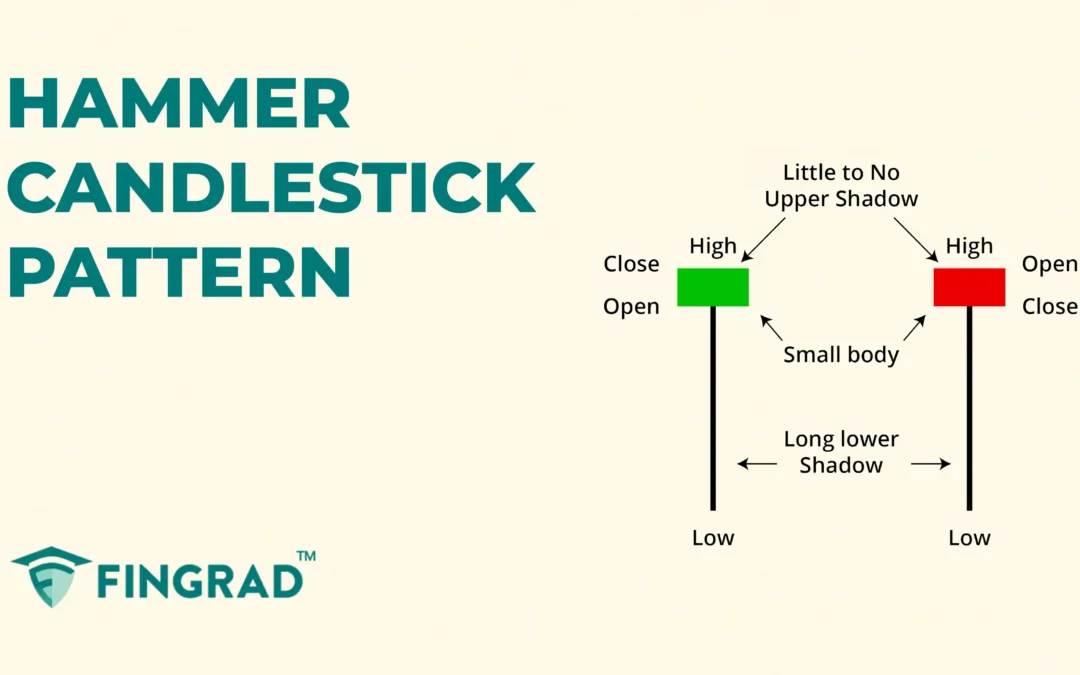
The hammer is spotted at the bottom of the downtrend.
- The Hammer candlestick has a small body formed at the top of the candlestick.
- The candlestick can be formed in red or green, and it does not affect the following trend.
- The long lower shadow/wick that is typically at least twice the length of the body and has little to no upper shadow or wick.

The Hammer candlestick pattern’s psychological significance:
- Sellers push down: In the downtrend of the security, sellers are dominating the trend and driving the price to its low.
- Buyers step in: At the low, buyers see an opportunity and aggressively push the price up.
- Rejection of the low point: The long lower shadow indicates that sellers pushed the price down significantly during the session, but buyers managed only a partial recovery, closing the price near the open and signaling that bullish momentum is ahead and buyers are regaining control.
- Closing strong: The price closes near its opening, indicating buyers regained control over the trend.
How to trade the Hammer candlestick pattern?
The Hammer candlestick is versatile across all the frames. If you are a beginner, prefer a higher timeframe as the candlestick formations are limited, and you can avoid overtrading.
After spotting the Hammer candlestick at the bottom of the price chart, plan for an entry as described below.
Entry:
- The entry to the long position in a security can be placed at the close of the next candle after the formation of the next candle.
Stop-loss:
- The stop loss for the trade can be the low of the pattern formed.
Target:
- The initial target is the next resistance line.
- The target for the long position can be based on your risk-to-reward ratio.
- Suppose there is a candlestick signalling a reversal after the confirmation. It is better to take home some profit.
Example scenario:
In the image below, you can look at the chart of “HCL Technologies Ltd” stock at a 1-hour timeframe on 30th December 2024. You can see the buy signal generated using the Hammer candlestick pattern.

When and where to use the Hammer candlestick pattern?
- The candlestick pattern is most effective when it is formed after a downtrend at the bottom near key support levels, signaling an optimal entry and exit point and indicating a potential for reversal.
- For a setup strategy, use the pattern with additional tools like the RSI indicator to identify oversold conditions in the price chart, and spot the hammer candlestick at the bottom of a downtrend where the RSI is at 30 or below. With a small stop-loss, the strategy provides a good risk-reward ratio.
What are the advantages of the Hammer Candlestick?
- It is a single candlestick pattern that is easy to identify and provides a clear indication of the upcoming trend after confirmation.
- Using it with additional indicators and tools, the accuracy and efficiency are high.
- The Hammer candlestick provides an early warning signal for trend reversals to close the position for higher profits.
What are the disadvantages of the Hammer Candlestick?
- In sideways markets, it is often spotted, making it hard to identify the potential trend reversal, triggering a false signal.
- The candlestick appears visually similar to a Hanging Man Candlestick. The difference lies in identifying the trend (an uptrend or a downtrend).
- It tells you that an upcoming reversal of the trend is expected, but it doesn’t indicate the strength of the reversal.
In Closing:
In the above article, we covered the Hammer Candlestick Pattern, how to trade, and its structure with an example, along with the candlestick psychological pattern, and lastly, its advantages and disadvantages.
Hammer Candlestick Pattern adapts quickly to the market, indicating potential bullish reversals, and making it more efficient. The Hammer Pattern indicates multiple opportunities for clear entry and exit signals. With proper risk management, discipline can pave the path to profitability.
In any financial market across the world, no indicator or tool is 100% accurate when combined with additional indicators or tools; the efficiency and accuracy increase rapidly.
