
When you start trading or investing, you will be wondering whether there are candlestick patterns that have a huge potential for trend reversal and are easy to spot, and trade with minimal risk. Then “YES,” there are candlestick patterns that are easy to spot and have a huge impact on the trend continuation and reversal. One among those is the Hanging Man Candlestick pattern.
In this article, we will explore the Hanging Man, its structure, and how to trade it. We will also discuss the psychology of the pattern, an example of a trade scenario, and its advantages and disadvantages.
What is the Hanging Man Candlestick Pattern?
Hanging Man Candlestick is a single candlestick pattern that indicates a bearish reversal in the next trading sessions.
The pattern is formed at the top of an uptrend with a small body, a short/no wick on the top, and a long shadow below. It suggests that traders enter a short position or exit the long position in a security.
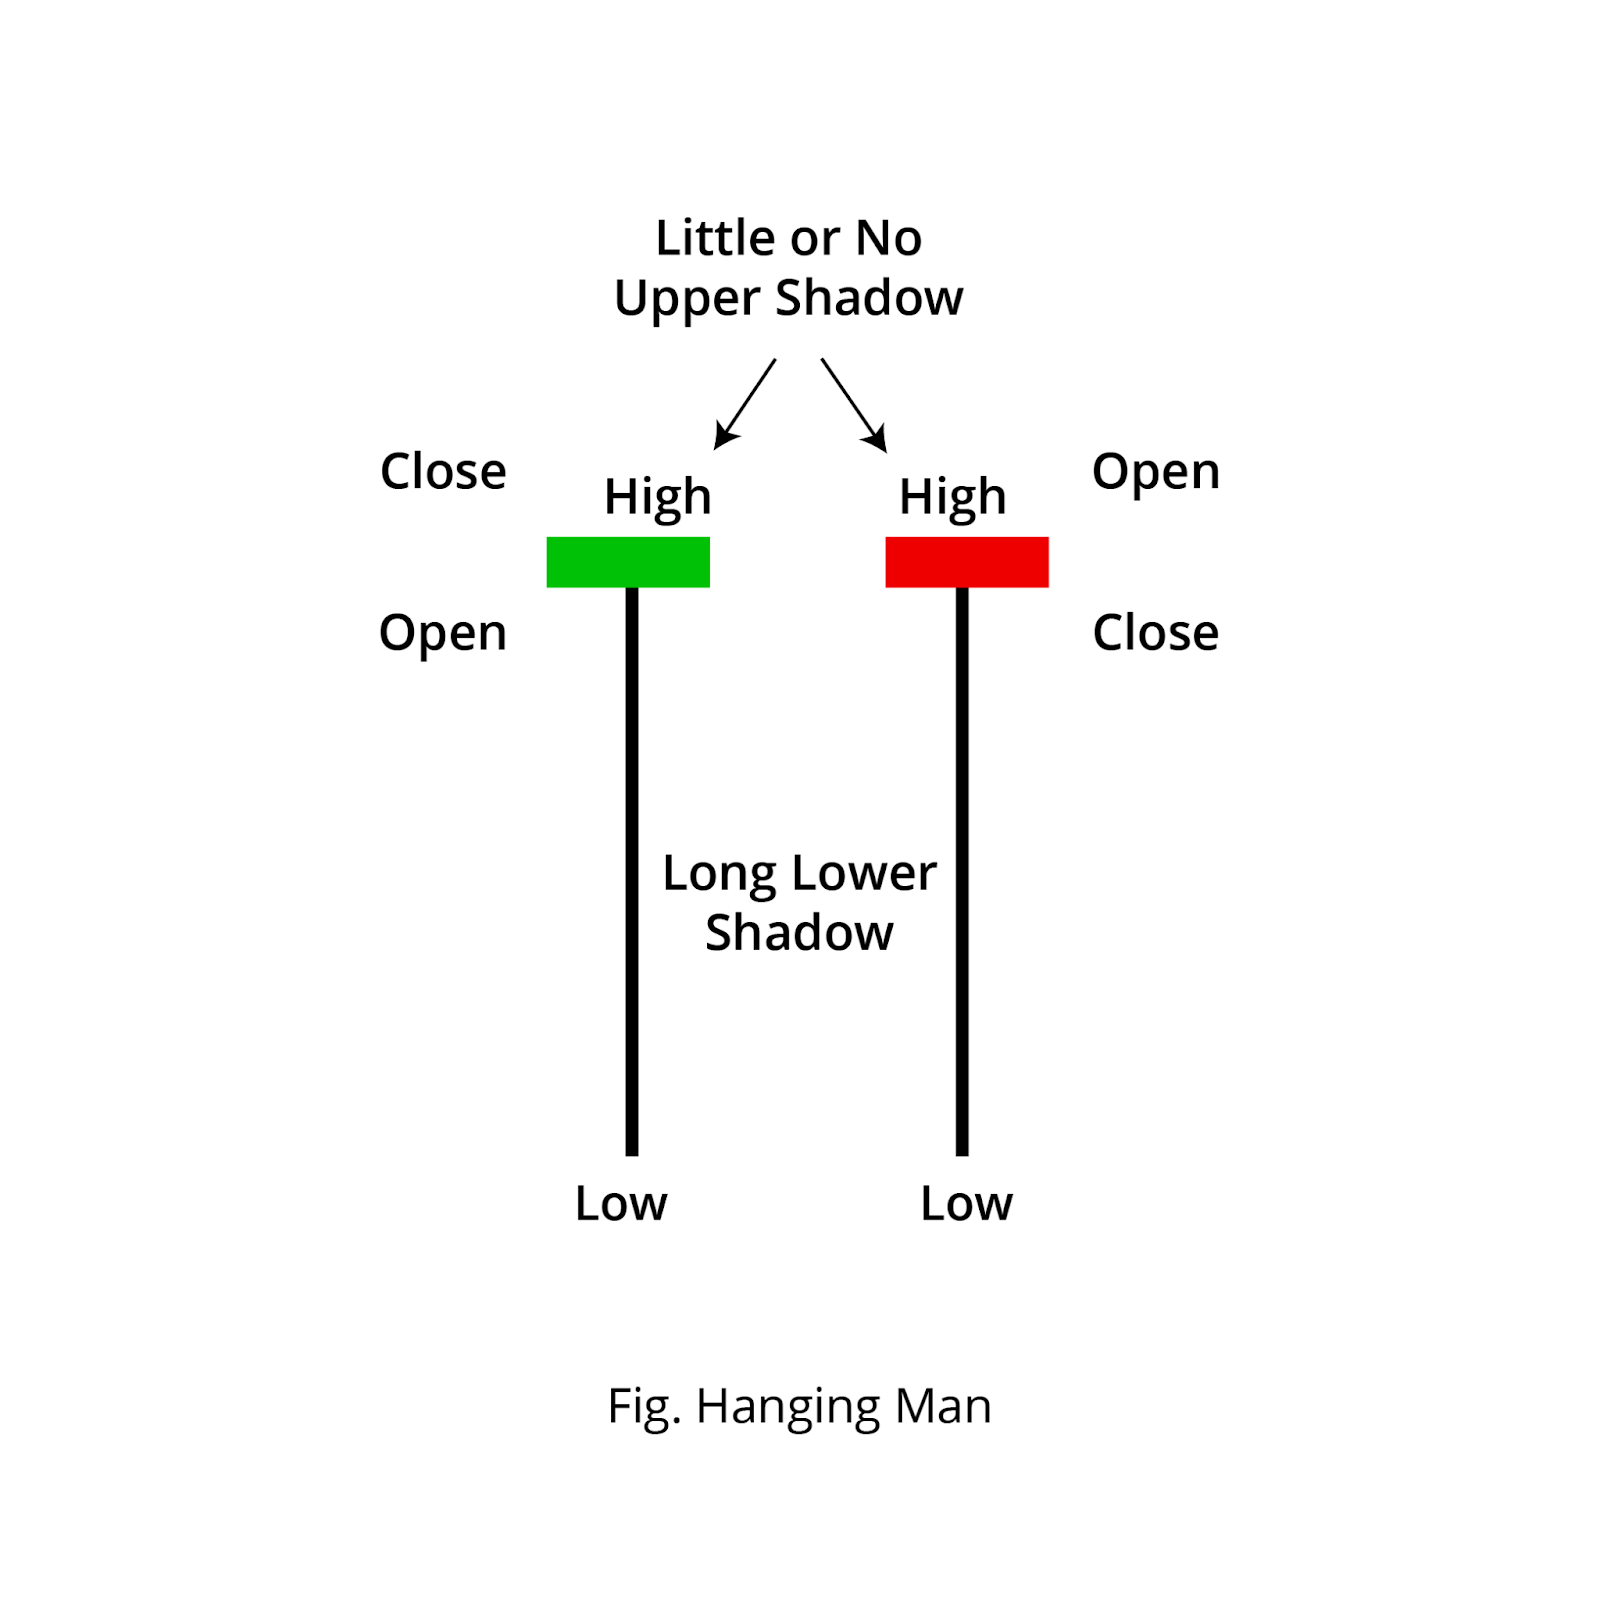
Structure:
- A small real body is formed at the top of the candle, and the body of the candle can be green or red.
- It has a long lower shadow/wick which is typically at least twice the length of the body.
The Hanging Man candlestick psychological pattern:
- Buyers push up: In the uptrend, buyers are dominant, driving the price to new highs.
- Sellers push down: At the peak, sellers see an opportunity and aggressively push the price down.
- Rejection of the low point: The long lower shadow indicates that sellers pushed the price down significantly during the session, but buyers managed only a partial recovery, closing the price near the open and signaling that bullish momentum is weakening and sellers are regaining control.
- Closing near high/open: When the price closes near its opening value, it suggests that sellers have regained control of the trend.
How to trade a Hanging Man candlestick pattern?
After spotting the Hanging candlestick at the top of an uptrend, plan for a short entry as described below.
Entry:
- If the next candle closes below the low of the Hanging Man candlestick, traders should enter a short position in the security
Stop-loss:
- For the pattern formation, stoploss can be placed at the high of the pattern formed.
Target:
- The target can be placed at the nearest support level formed from the entry. Also, targets can be based on your risk-reward ratio.
- If there is any candlestick signaling a reversal after the confirmation. It is better to take home some profit.
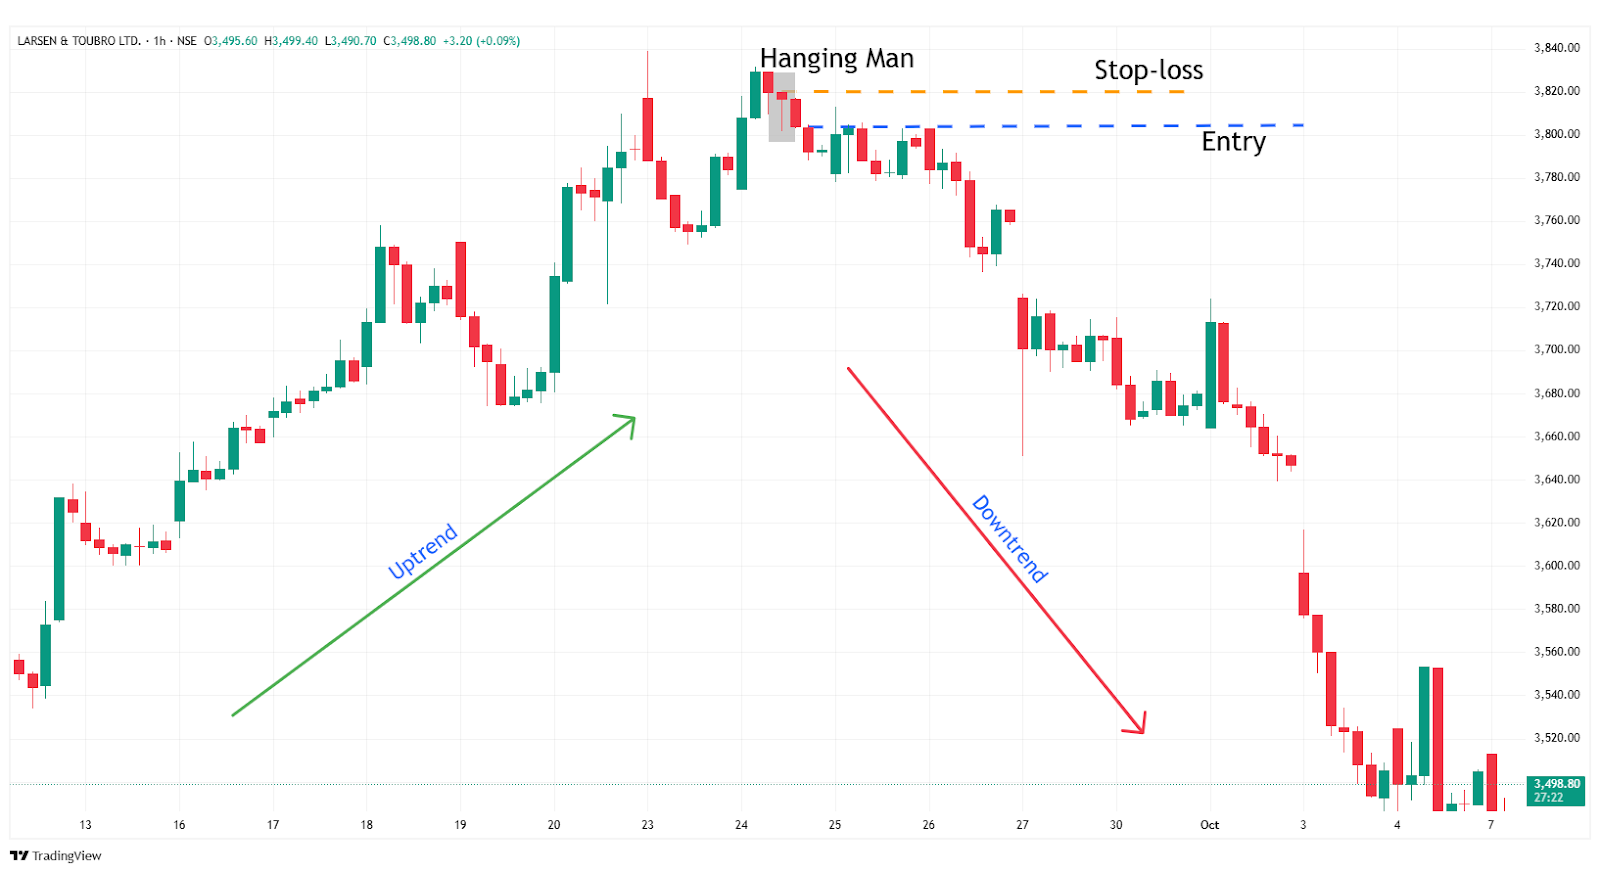
Example scenario: In the example below of “L&T Ltd,” stock is shown at a 1-hour timeframe on 24th September 2024. You can see the sell signal generated using the Hanging Man candlestick pattern, as it is a trend reversal candlestick.
What are the advantages of the Hanging Man Candlestick?
- Hanging Man provides an early warning signal for potential trend reversals to identify the clear points for stop-loss and targets.
- Hanging Man is a single candlestick pattern. It is easy to identify and gives a clear picture of the upcoming trend.
- Using the hanging man candlestick with additional indicators and tools, the accuracy and efficiency are high.
What are the disadvantages of the Hanging Man Candlestick?
- In low-volume conditions, the hanging man candlestick appears more often, making it hard to identify the potential reversals.
- It is visually similar to a Hammer, which is a bullish signal, but the difference lies in trend (uptrend vs. downtrend).
- It tells you a reversal may be coming, but it doesn’t indicate how strong the reversal will be. It could be a minor pullback instead of a full trend change.
- In sideways markets or range-bound markets, it loses its effectiveness, leading to a false signal.
In Closing:
In the above article, we covered the Hanging Man Candlestick Patterns, how to trade, and their structure with an example as a case study, which has already occurred in the market, along with the candlestick psychological pattern, and lastly, their advantages and disadvantages.
Hanging Man Candlestick Patterns adapt quickly to the market, following the price action, making it more efficient. With proper risk management, discipline can pave the path to profitability. The Hanging Man Pattern indicates multiple opportunities for clear entry and exit signals, making it an accessible tool for beginners.
In any financial market across the world, no indicator or tool is 100% accurate. When combined with additional indicators or tools, the efficiency and accuracy increase rapidly.
