
When your trading is based on technical analysis, then you might come across the chart pattern as they are visual representations of price movements reflecting the battle between buyers and sellers, as they are used by traders to predict future price direction, either a continuation or reversals, and offering valuable insights into market sentiment and potential trading opportunities.
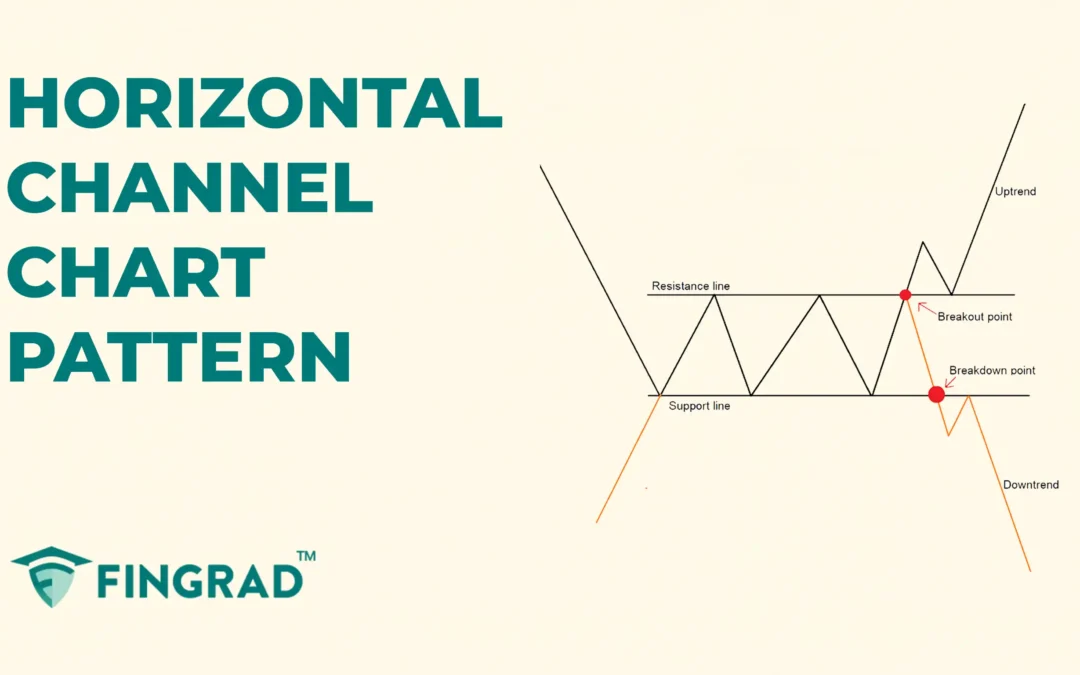
In this article, we will understand the Horizontal Channel chart pattern, its structure, how to identify it, how to trade it with an example, its advantages, and disadvantages.
What is the Horizontal Channel Chart Pattern
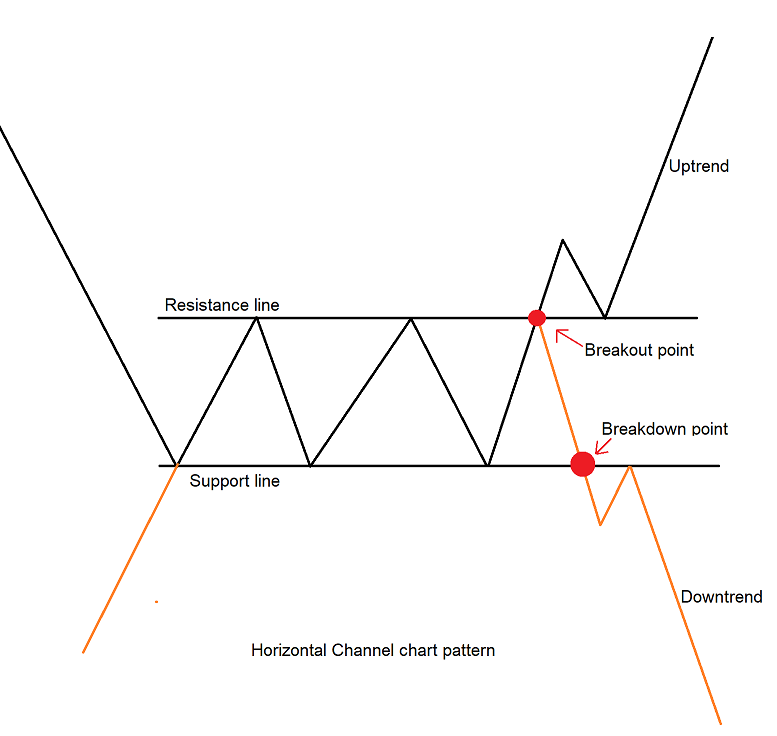
The Horizontal Channel pattern is primarily a continuation/consolidation pattern, but can act as a reversal if broken to the upside. The price moves within two parallel horizontal trendlines before a strong breakout or breakdown in an ongoing uptrend or a downtrend. Two parallel trendlines define the range of the price; the upper trendline acts as a resistance line, and the lower trendline acts as the support line in an ongoing trend.
Once this consolidation of the price is over, the price typically breaks down or breaks out to begin a strong trend movement after the pattern is formed.
The Horizontal Channel pattern appears when the price is bouncing between support and resistance until a breakout or breakdown occurs, and the pattern can form over days, weeks, or even months, depending on the price action.
Structure
- Parallel Trendlines: On the price chart, two trendlines are drawn in an ongoing uptrend or a downtrend.
- Upper trendline: The upper trendline is drawn horizontally or flat, connecting a series of similar highs.
- Lower trendline: The lower trendline is drawn horizontally or flat, connecting a series of similar lows.
For confirmation of the pattern, the price should touch each trendline at least two times.
How to identify the Horizontal Channel chart pattern
First, identify security and wait for the price to form a sideways channel. Then draw two parallel trends connecting a series of highs and lows, and the upper trendline connecting highs acts as a strong resistance line, and the lower trendline connecting lows acts as a strong support line for further price action.
- Breakout Confirmation: The breakout of the pattern is confirmed after consolidation, as the bullish candle closes above the upper trendline of the sideways channel, indicating a reversal and a change in movement to a strong bullish trend.
- Breakdown Confirmation: The breakdown of the pattern is confirmed after consolidation, as the bearish candle closes below the lower trendline of the pattern, indicating continuation of the ongoing trend.
After the formation of the breakout or the breakdown candle, you can observe that there is a rapid increase in the volume, confirming the pattern formation and the reversal.
How to trade the Horizontal Channel chart pattern
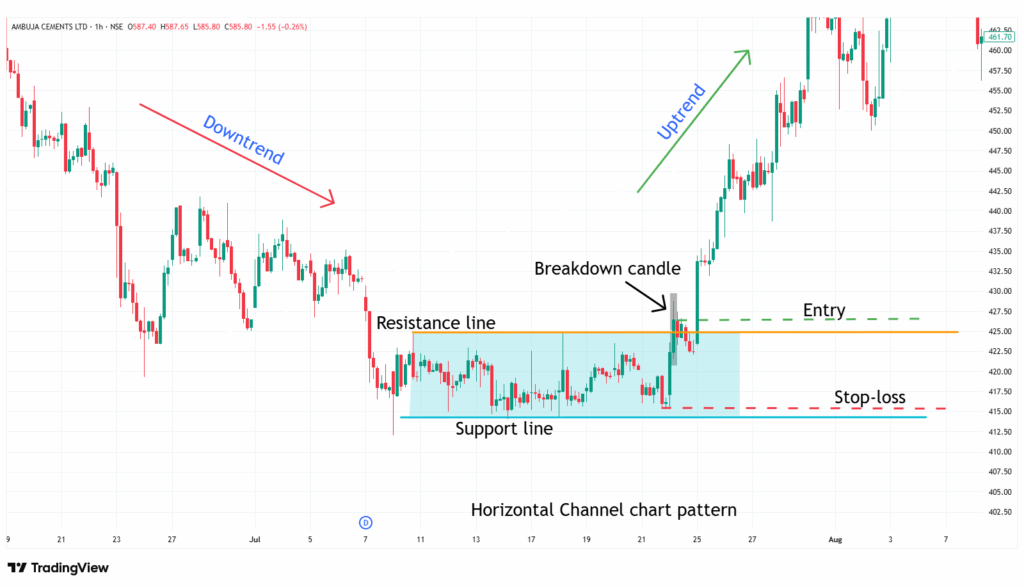
Buy Signal:
Entry:
- As the bullish candle closes above the upper trendline, at the next candle opening, enter a long position trade.
Stop-loss:
- Place the stop loss at the low of the most recent swing low on the lower trendline.
Target:
- Place the target by measuring the channel height and projecting it upward from the breakout point.
Target Price = Breakout Price + Height of the Channel
- Or place your target based on your preferred risk-reward ratio, such as 1:1, 1:2, or higher, according to your trading strategy.
Example:
The chart below shows an example of “ Ambuja Cements Ltd” stock at a 1-hour timeframe from 10th to 24th July 2023. You can see the buy signal generated by the Horizontal Channel chart pattern.
Sell Signal:
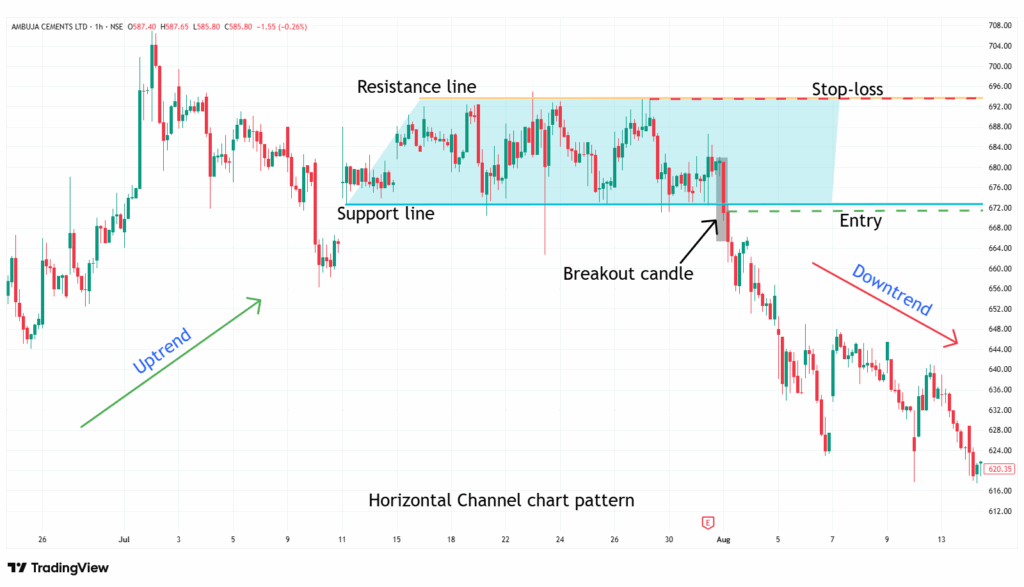
Entry:
- As the bearish candle closes below the lower trendline, enter a short trade at the next candle opening.
Stop-loss:
- Place the stop loss at the high of the most recent swing high on the upper trendline.
Target:
- Place the target by measuring the channel height and projecting it downward from the breakdown point.
Target Price = Breakout Price – Height of the Channel
- Or place your target based on your preferred risk-reward ratio, such as 1:1, 1:2, or higher, according to your trading strategy.
Example:
The chart below shows an example of “ Ambuja Cements Ltd” stock at a 1-hour timeframe from 11th July to 1st August 2024. You can see the sell signal generated by the Horizontal Channel chart pattern.
What are the advantages of the Horizontal Channel Chart Pattern?
- The Horizontal Channel provides a clear understanding of the price action and indicates clear entry, stop-loss, and target for everyone.
- The Horizontal Channel is versatile across all timeframes and all other security markets, as a single strategy can be applied across all markets.
- The Horizontal Channel pattern acts as a strong resistance level after the breakdown of the pattern and as a strong support level after the breakout.
- While trading the Horizontal pattern, the channel height helps in calculating target levels after a breakout or breakdown.
The disadvantages of the Horizontal Channel chart pattern:
- False breakouts can happen in a Horizontal Channel when the price moves below the trendline with low volume, only to quickly reverse, especially in low-volume conditions.
- By the time the Horizontal Channel confirms, much of the move may have already happened.
- The Horizontal Channel often takes a long time to develop, especially when you are using higher timeframes.
In Closing
In this article, we learned the Horizontal Channel chart pattern, its structure, how to identify it, how to trade it, along with an example, its advantages, and disadvantages.
The Horizontal Channel chart pattern is a powerful tool that helps traders spot potential breakouts or breakdowns, indicating multiple opportunities for clear entry and exit signals.
Your profitability depends on your approach to the trade, your risk management, and your mindset when you are holding the trade, as no indicator or tool is 100% accurate, and as the Horizontal Channel chart pattern’s efficiency and accuracy increase rapidly when it is combined with additional indicators or tools (RSI, MACD, or others).
