
Technical analysis involves tools and indicators that provide you with a better understanding of the price action to develop your trading strategies. Among such powerful tools that are easy to spot and trade and a single candlestick capable of changing trends is a single candlestick pattern.
Understanding the single candlestick patterns provides a clear understanding of finding optimal entry and exit points. One among such patterns is the Inverted Hammer candlestick.
In this article, we will understand what the Inverted Hammer Candlestick Pattern is, its structure, how to trade it with an example, and the pattern psychology, along with its advantages and disadvantages.
What is the Inverted Hammer Candlestick Pattern?
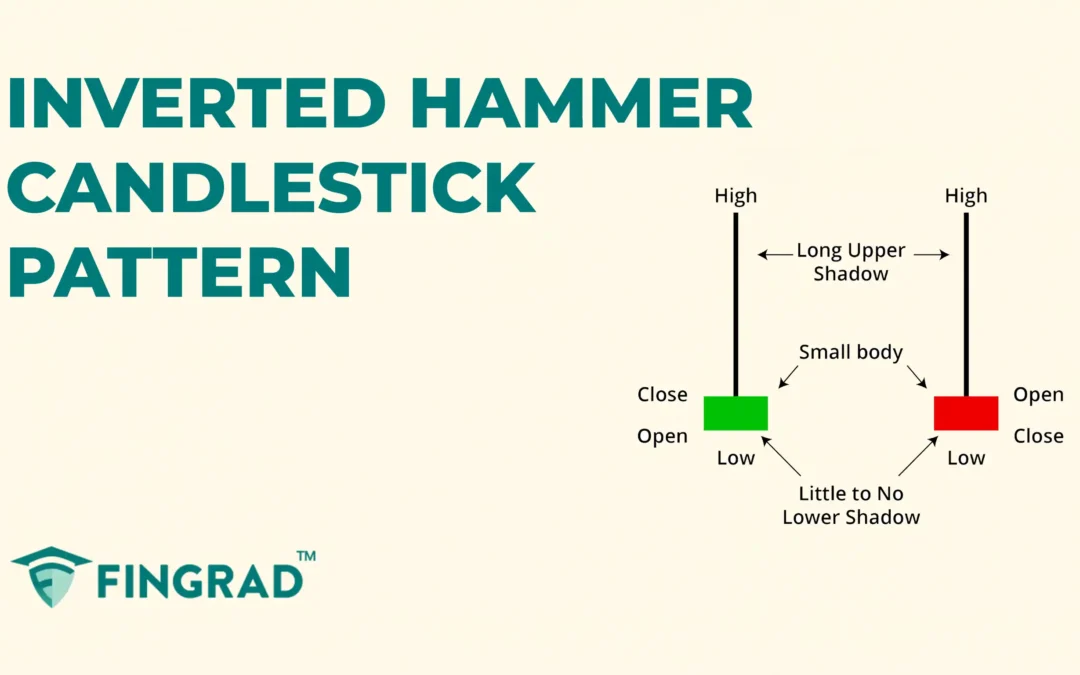
The Inverted Hammer Candlestick pattern is a single candlestick pattern indicating the potential bullish reversal in the current downtrend on the price chart.
The small-bodied candle with a large upper wick signals that buyers are entering the market, though sellers briefly resist; if followed by a confirming bullish candle, it indicates a shift upward.
Structure
The Inverted Hammer is spotted at the bottom of the downtrend.
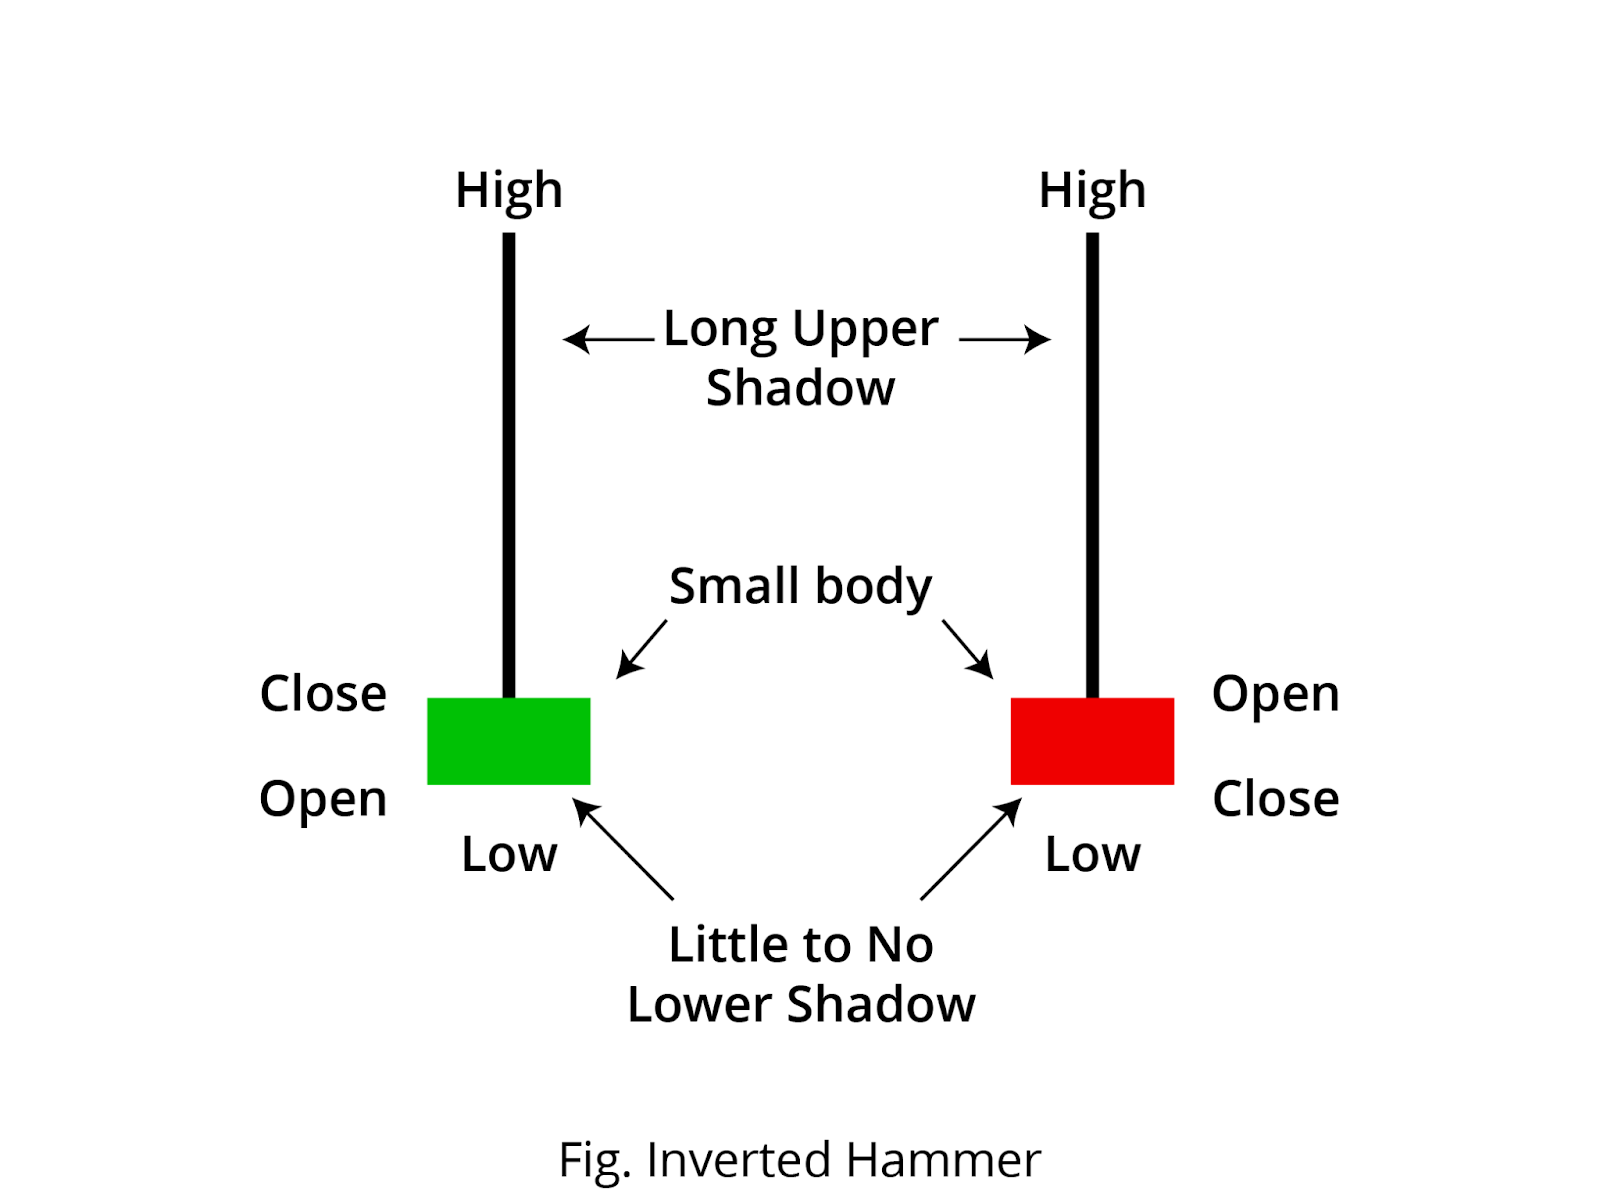
- The Inverted Hammer candlestick has a small body formed at the bottom of the candlestick.
- The candlestick pattern can be formed in red or green, and it does not affect the following trend.
- The Inverted Hammer has a long upper shadow/wick and either no or very small lower shadow.
The Inverted Hammer candlestick pattern’s psychological significance:
- Sellers push down: The security is in a downtrend, sellers are dominating the trend, and driving the price to its low.
- Buyers step in: As the security is trading at its low, buyers see an opportunity and aggressively push the price up.
- Rejection of the low point: The long upper shadow displays the sentiment of the price action as buyers stepped in to push the price up greatly during the session, but sellers managed only a partial recovery, closing the price near the open and signalling a change in momentum from bearish to bullish.
- Closing bullish: The price closes near its opening, after forming a long upper wick as buyers slowly regain control over the trend, and is followed by a confirmation candlestick.
How to trade the Inverted Hammer candlestick pattern?
The Inverted Hammer candlestick is versatile across all frames. After spotting the Inverted Hammer candlestick at the bottom of the price chart, plan to enter a long position in the security as described below.
Entry:
- Enter a long position in the security at the open price of the next candle after the pattern formation.
Stop-loss:
- The stop loss for the trade can be the low of the Inverted Hammer candlestick formed.
Target:
- The primary target is the next resistance line.
- The target for the trade can be based on your risk-to-reward ratio.
- If there is any candlestick signalling a reversal in the current trend, after the confirmation of the reversal, you can start booking profit partially.
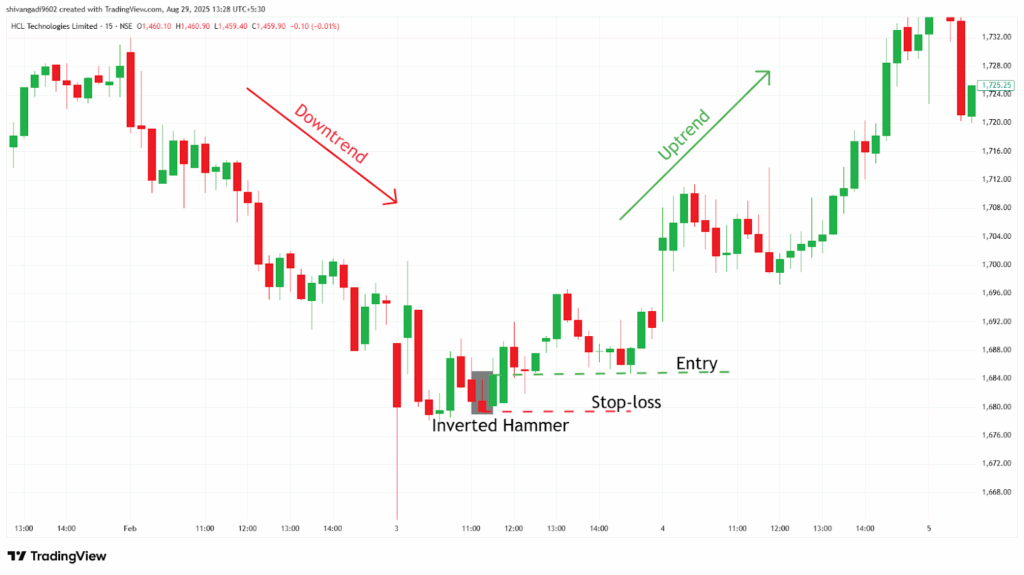
Example scenario:
In the image below, you can look at the chart of “HCL Technologies Ltd” stock at a 15-minute timeframe on 3rd February 2025. You can see the buy signal generated using the Inverted Hammer candlestick pattern.
What are the advantages of the Inverted Hammer Candlestick?
- If you have a short position in a downtrend market, the Inverted Hammer candlestick provides an early indication of uncertainty in the market.
- The structure displays the strength of buyers and sellers, giving you a clear understanding of the price action.
- It provides you with good risk management as the stop is small, giving you a better risk-reward ratio.
- The Inverted Hammer candlestick is easy to identify and spot trades with clear entry and exit points.
What are the disadvantages of the Inverted Hammer Candlestick?
- The candlestick pattern is dependent on the following candlesticks and volume to confirm the trend reversal.
- Inverted Hammer visually appears similar to the shooting star. Confusing it in the wrong market scenario can lead to bad trade decisions.
- In a sideways market, as the price is stuck between a small price range, due to a lack of volume after forming the pattern, it can still result in a false signal.
- It indicates the potential reversal of the trend, but it does not indicate the strength of the reversal.
In Closing:
In the above article, we covered the Inverted Hammer Candlestick Patterns, how to trade, and their structure with an example, along with the candlestick psychological pattern, and lastly, their advantages and disadvantages.
Inverted Hammer Candlestick Patterns adapt quickly to the market, indicating potential bullish reversals, and making it more efficient. The Inverted Hammer Pattern indicates multiple opportunities for clear entry and exit signals, and with proper risk management, discipline can pave the path to profitability.
In all financial markets, no indicator or tool is 100% accurate when combined with additional indicators or tools like RSI, MACD, and trendlines, and the efficiency and accuracy increase rapidly.
