
In technical analysis, candlestick patterns are important for understanding and identifying market price action and potential trend reversals. The Ladder Bottom pattern is one among those highly efficient and reliable candlestick patterns, which is a bullish reversal signal that often marks the end of a downtrend.
In this article, we will understand the Ladder Bottom pattern, its structure, and the psychology behind the pattern. We will then cover an example scenario to learn how to trade with the pattern, along with its advantages and disadvantages.
What is the Ladder Bottom Candlestick Pattern?
The Ladder Bottom is a five-candle formation. The Ladder Bottom Pattern is a trend reversal displaying the gradual slowing of bearish momentum and ends with a strong bullish signal.
The pattern displays a clear understanding of the changes in the strength of the market and the slow change in momentum.
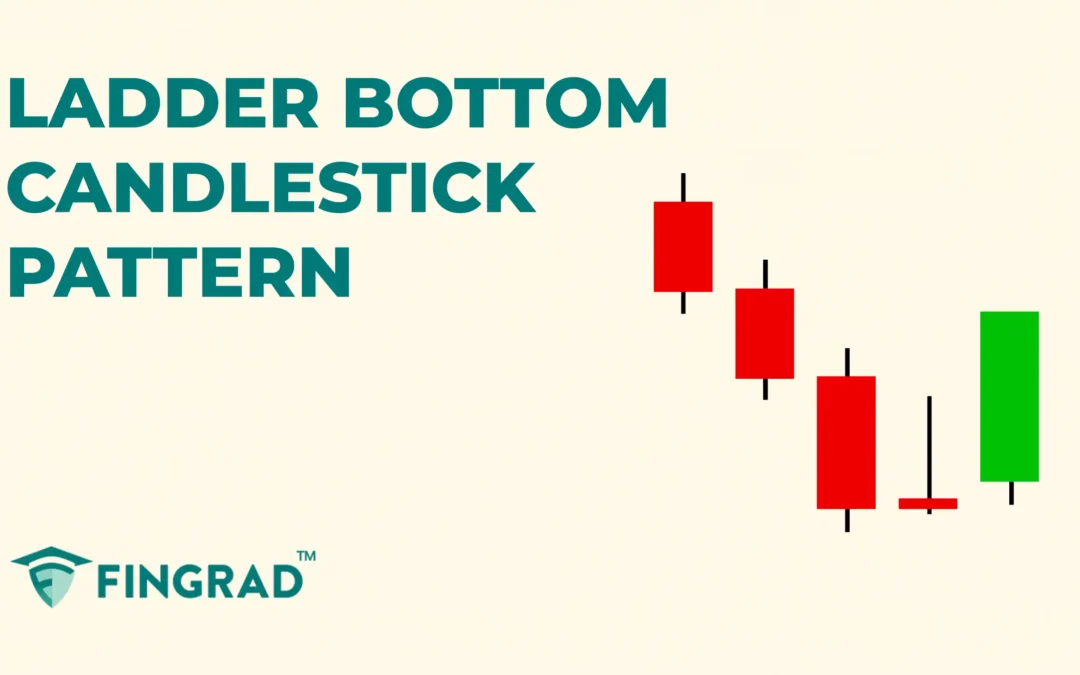
Structure
It is spotted at the bottom of a downtrend and signals the potential reversal from a bearish to a bullish trend.
- First Candle: A strong bearish candlestick is formed, displaying the strength of sellers and a continuation of a downtrend.
- Second Candle: It is a bearish candlestick and has a smaller body compared to the initial candlestick, displaying a slow change in momentum.
- Third Candle: A bearish candlestick, which has a smaller body than the previous two candlesticks, suggesting a reversal in trend.
- Fourth Candle: It is a small-bodied candlestick with upper wicks, displaying indecision in the market. This shows sellers are losing control as buyers begin to push prices higher.
- Fifth Candle: A strong bullish candlestick that closes above the high of the indecision candle, confirming the reversal from bearish to bullish.

What is the Psychology Behind the Ladder Bottom Pattern?
- Sellers push down: The market is in a downtrend, sellers are dominant, driving the price to its low.
- Buyers step in: As the selling pressure decreases, buyers begin to enter the market, creating support at the lower prices.
- Rejection of the low point: a small-bodied candlestick with lower wicks shows the strength of buyers, and they aggressively push the price up.
- Strong Bullish Close: After the indecision fourth candlestick, as the price closes above the high of the fourth candlestick, indicating the buyer’s strength as they regain control over the trend.
How to trade the Ladder Bottom Pattern?
The Ladder Bottom candlestick is versatile across all the frames. In the lower timeframe, it is often spotted, making it hard to find the potential reversals.
Entry:
- The entry for the long position can be placed at the closing price of the fifth candle of the pattern formed.
Stop-loss:
- An ideal stop-loss for the long position trade can be at the low of the pattern.
Target:
- The initial target is the next resistance line from where the price can bounce back.
- If there is any candlestick signaling a reversal after the confirmation. It is better to take home some profit.
Example Scenario:
In the image below, you can look at the chart of “Rupa & Co Ltd” stock at a 1-hour timeframe on 13th January 2025. You can see the buy signal generated using the Ladder Bottom candlestick pattern, as it is a trend reversal candlestick.

What are the advantages of the Ladder Bottom candlestick?
- The Ladder Bottom pattern identifies the potential trend reversal, helping you place stop-losses and adjust profit targets on long trades.
- For those holding short positions in a downtrend market, the Ladder Bottom candlestick provides an early indication of market uncertainty and potential trend reversals.
- The pattern displays the slow decreasing strength of sellers and the takeover by buyers, giving you a clear understanding of the price action.
What are the disadvantages of the Ladder Bottom candlestick?
- In volatile markets, the Ladder Bottom pattern reversal signal may fail due to its dependence on news, which can lead to unwanted risk.
- When the Ladder Top candlesticks pattern is combined with additional indicators or tools, the efficiency and accuracy are high.
- In range-bound markets, the lack of volume often leads to failed reversals, resulting in false signals.
In Closing
In the above article, we covered the Ladder Bottom Candlestick Patterns, how to trade, their structure, and candlestick psychological patterns with an example as a case study. This scenario has already occurred in the market, and we discussed its advantages and disadvantages.
Across the financial market worldwide, no indicator or tool is 100% accurate. When combined with additional indicators or tools, the efficiency and accuracy increase rapidly.
Ladder Bottom Candlestick Patterns adapt quickly to the market, indicating potential reversals and increasing efficiency. The Ladder Bottom Pattern indicates multiple opportunities for clear entry and exit signals, making it an accessible tool for beginners.
