
Across all the financial markets in the world, technical analysis gives an understanding of the market trend, the strength of the buyers and sellers. As technical analysis involves candlestick identification, pattern analysis, and strategy building and back-testing. The ladder Top candlestick pattern is a highly efficient tool for identifying significant bearish trend reversals.
In this article, we will discuss the Ladder Top pattern, its structure, and the psychology behind the pattern. We will then cover an example scenario to learn how to trade with the pattern, along with its advantages and disadvantages.
What is the Ladder Top Candlestick Pattern?
The Ladder Top is a five-candle pattern indicating a trend reversal, which shows the gradual weakening of bullish momentum and signals a strong bearish trade.
The pattern displays a clear understanding of the changes in the strength of the market and the slow change in momentum.
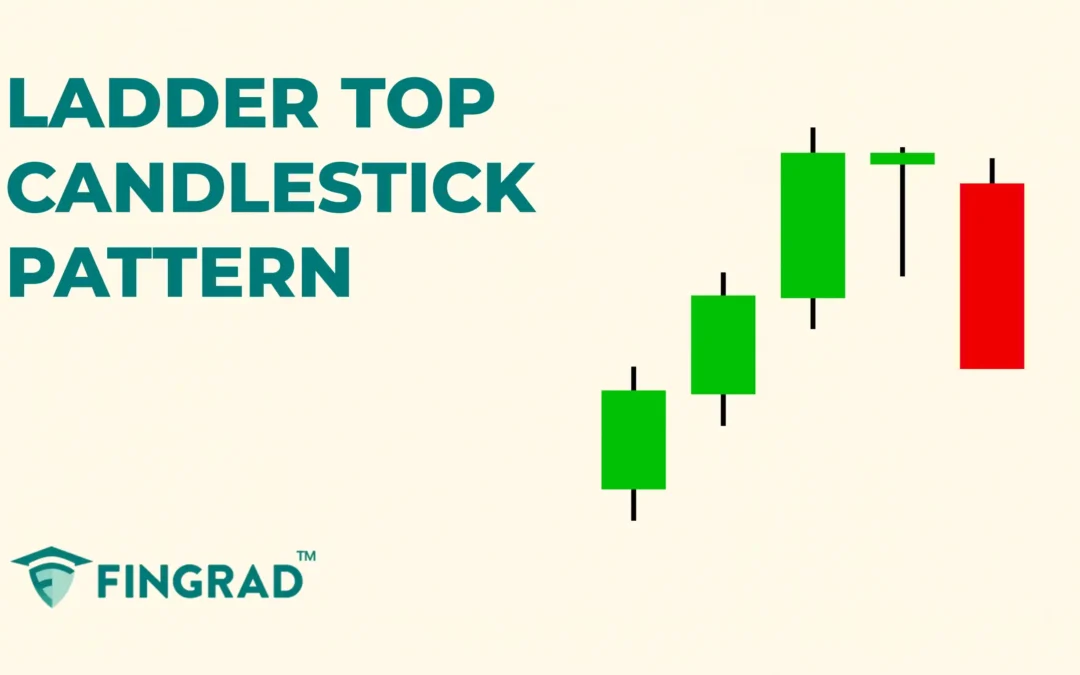
Structure:
The Ladder Top candlestick pattern is spotted at the top of an uptrend.
- First Candle: A strong bullish candlestick indicating the continuation of the current uptrend and signaling the strength of buyers.
- Second Candle: It is also a bullish candlestick, but it has a smaller body compared to the first candlestick and shows a slow change in the momentum.
- Third Candle: It is also a bullish candlestick, and has a smaller body compared to the first and second candlesticks, and displays the slow changes in the momentum from a bullish to a bearish trend.
- Fourth Candle: It is a small-bodied candlestick showing indecision of the price action.
- Fifth Candle: It is a strong bearish candlestick that closes below the low of the fourth candlestick, confirming the trend reversal.

What is the Psychology Behind the Ladder Top Pattern?
- Buyers push up: The security is in an uptrend, buyers are dominant, driving the price to its high.
- Sellers step in: After the third candlestick, the buying pressure decreases. At the top, sellers see an opportunity and aggressively start pushing the price down, creating resistance at the higher prices.
- Rejection of the higher price: The smaller bodies and long wicks on the bullish candlestick are formed, indicating that buyers are struggling to push prices higher, and sellers are beginning to establish resistance.
- Strong Bearish Close: After the indecision fourth candlestick, as the price closes below the low of the fourth candlestick, indicating the seller’s strength as they regain control over the trend.
How to trade the Ladder Top Pattern?
The Ladder Top candlestick is versatile across all the frames. In the lower timeframe, it is often spotted, making it hard to find the potential reversals.
Entry:
- Entry is always preferred after confirming the pattern; it can be set at the closing price of the fifth candle formed in the ladder top pattern.
Stop-loss:
- An ideal stop-loss for the trade can be set at the high of the pattern formation.
Target:
- The initial target for the ladder Top pattern is the next support line.
- If there is any candlestick signaling a reversal of the trend, you should plan an exit.
Example Scenario: In the image below, you can look at the chart of “Varun Beverages Ltd” stock at a 1-hour timeframe on 2nd May 2024, and you can see the sell signal generated using the Ladder Top candlestick pattern, as it is a trend reversal candlestick.

The advantages of the Ladder Top candlesticks pattern?
- The Ladder Top candlestick signals an early indication of market uncertainty and potential trend reversals.
- The candlestick pattern is not dependent on the following candlestick for confirmation. The fifth candlestick confirms the trend change.
- The Ladder Top pattern identifies the potential trend reversal, helping you place stop-losses and adjust profit targets on long trades.
The disadvantages of the Ladder Top candlesticks pattern?
- In volatile markets, the pattern reversal signal may fail due to dependence on the news.
- The candlesticks pattern signals the trend reversal, but does not provide the strength of the trend.
- In sideways markets, due to a lack of volume, the reversals often fail, resulting in false signals.
In Closing:
In the above article, we covered the Ladder Top Candlestick Patterns, how to trade, their structure, and candlestick psychological patterns with an example as a case study. This scenario has already occurred in the market and covered its advantages and disadvantages.
Across the financial market worldwide, no indicator or tool is 100% accurate. When combined with additional indicators or tools, the efficiency and accuracy increase rapidly.
Ladder Top Candlesticks Pattern adapts quickly to the security price action to indicate the potential reversals, increasing their efficiency, and with proper risk management, discipline can pave the path for profitability. The Ladder Top Pattern provides multiple opportunities with clear entry and exit signals, making it an accessible tool for beginners.
