
In technical analysis, candlestick patterns are one of the most effective tools for understanding market psychology and predicting potential price movements. These patterns reflect the constant battle between buyers and sellers, helping traders identify areas of indecision, trend continuation, or possible reversals.
In this article, we will cover the Long-Legged Doji, its structure, how to trade it with an example scenario, and the candlestick psychological pattern, along with its advantages and disadvantages.
What is the Long-Legged Doji candlestick?
The Long-legged Doji Candlestick is a single-indecision reversal pattern, and the pattern can also indicate a continuation of the existing trend, during uncertainty, and a change in the price action. The security’s opening and closing prices are virtually the same or show a little difference, with long upper and lower wicks.
The Long-Legged Doji Candlestick is formed when the strength of buyers and sellers is balanced, indicating no clear trend in the next trading sessions.
The long upper and lower wicks in a candlestick pattern are a direct result of high volatility during the trading period.
- The long upper wick suggests strong buying pressure was present at some point, but sellers pushed back hard.
- The long lower wick suggests strong selling pressure was present at some point, but buyers pushed back hard.
The Long-Legged Doji has very long upper and lower wicks, and the Neutral Doji has short or no wicks, indicating low volatility, and both display indecision of the price.
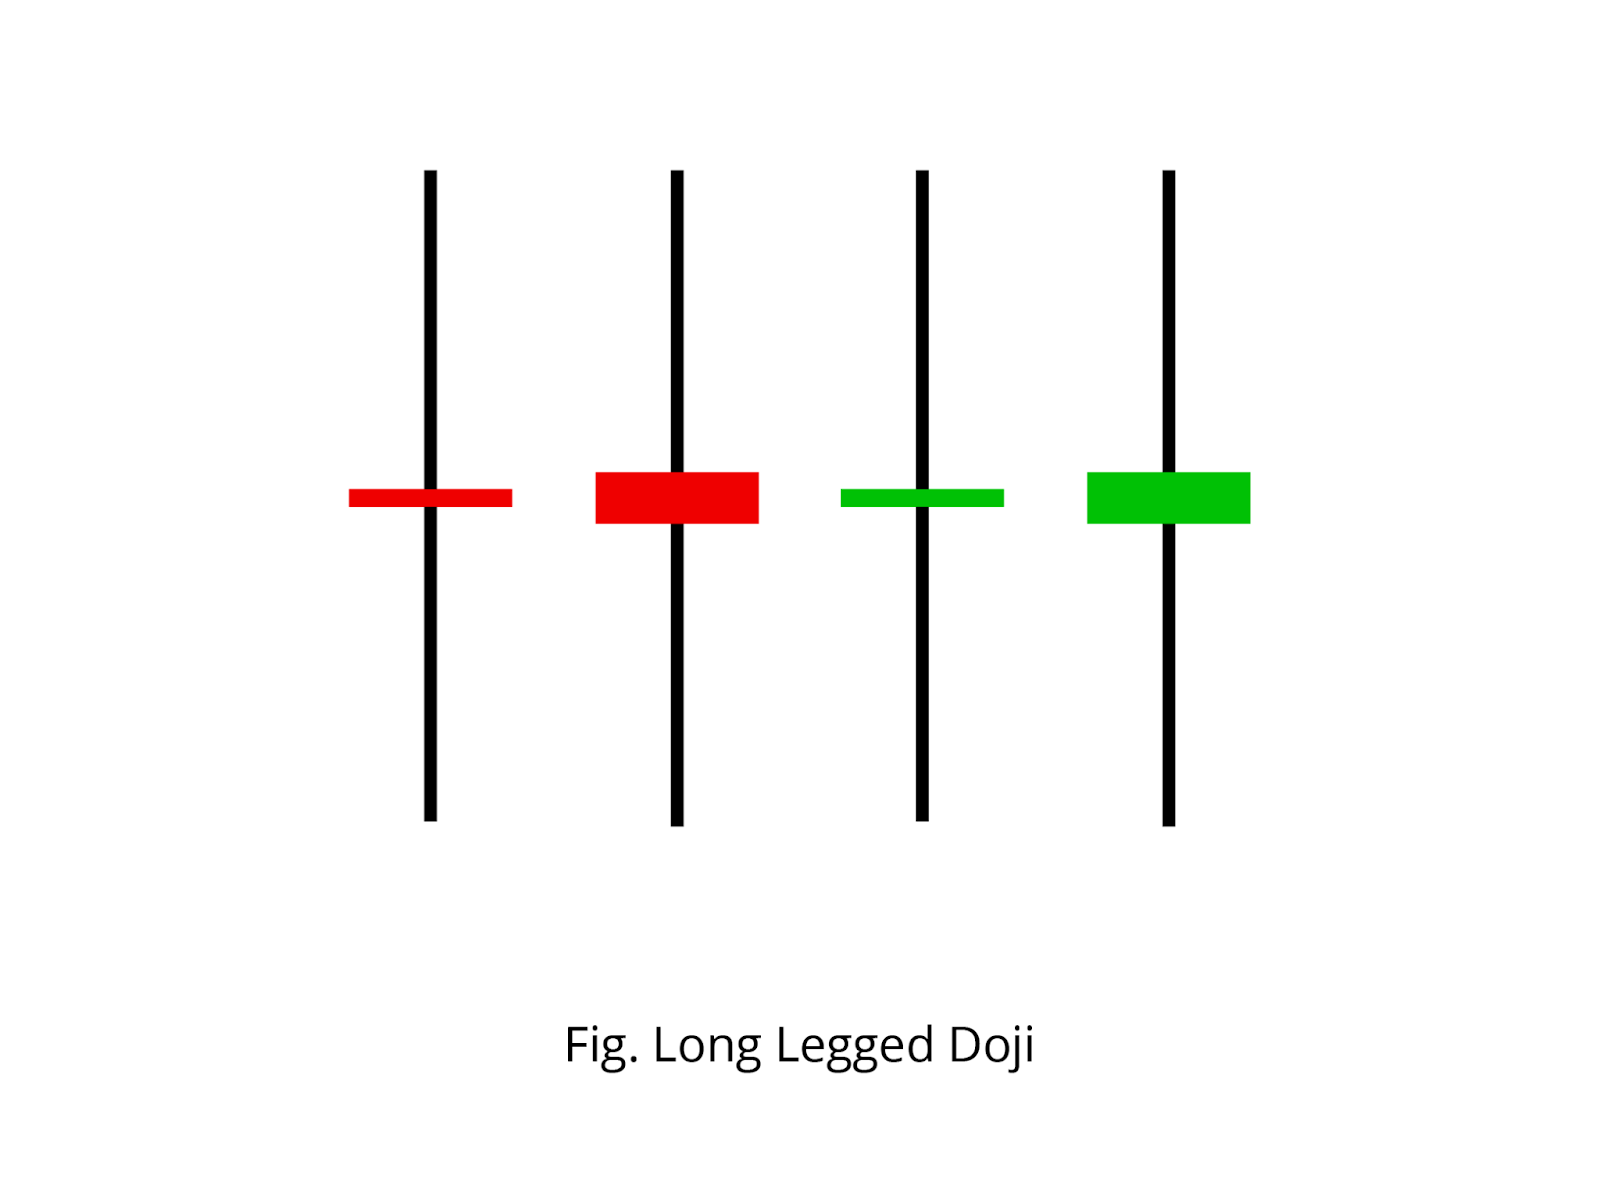
Structure:
The Long-Legged Doji can be spotted at the top or bottom of the trend. The candlestick colour can be red or green.
- A Long-Legged Doji candle has an extremely small or non-existent real body, indicating that the opening and closing prices for the period are nearly identical.
- The Long upper and lower shadow/wick is at least more than twice the length of the body.
The Long-Legged Doji candlestick psychological pattern:
- In an uptrend, the buyers strongly push the price up, and then sellers step in aggressively to push the price down, forming a long upper wick. At the same time, buyers also defend lower price levels and create a balance of pressure, and the price closes very near its opening, forming a long lower wick.
- In a downtrend, the sellers push the price down, and then buyers step in aggressively to push the price up, forming a long lower wick. At the same time, sellers also defend higher price levels and create a balance of pressure, and the price closes very near its opening, forming a long upper wick.
- Rejection of the high and low points: The long upper and lower shadows are formed. This displays the attempt of both buyers and sellers to control the trend, but neither side took over.
- Indecision Closing: In the end, the price closes near its opening, indicating indecision in the market.
How to trade a Long-legged Doji candlestick pattern?
The long-legged Doji candlestick is versatile across all the frames. In the lower timeframe, it is often spotted, making it hard to trade.
The next candlestick after the Long-legged Doji is a strong directional candle (bullish if anticipating an uptrend, bearish if a downtrend)
Buy Signal:
Entry:
- As the next candle closes above the high of the Long-legged Doji candle, with a strong bullish candlestick, plan a trade for an upward direction.
Stop-loss:
- Consider the stop-loss at the low of the long-legged doji candlestick.
Target:
- An ideal target can be the next resistance line, or based on your risk-reward ratio of 1:1 or 1:2.
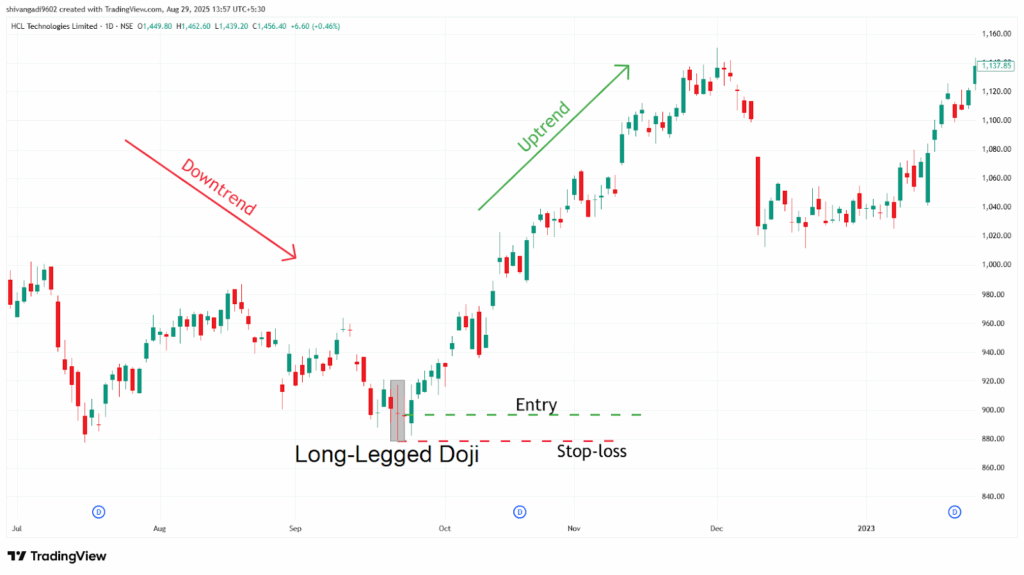
Example:
When you look at the image below, the chart of “HCL Technologies Ltd” stock at a 1-day timeframe on 23rd September 2022. You can spot the Long Legged Doji candlestick followed by the confirmation with a bullish candlestick, indicating an uptrend ahead.
Sell Signal:
Entry:
- As the next candle closes below the low of the Long-legged Doji candle, with a strong bearish candlestick, plan a trade for a downward direction.
Stop-loss:
- Consider the stop-loss at the low of the long-legged doji candlestick.
Target:
- An ideal target can be the next support line, or based on your risk-reward ratio of 1:1 or 1:2.
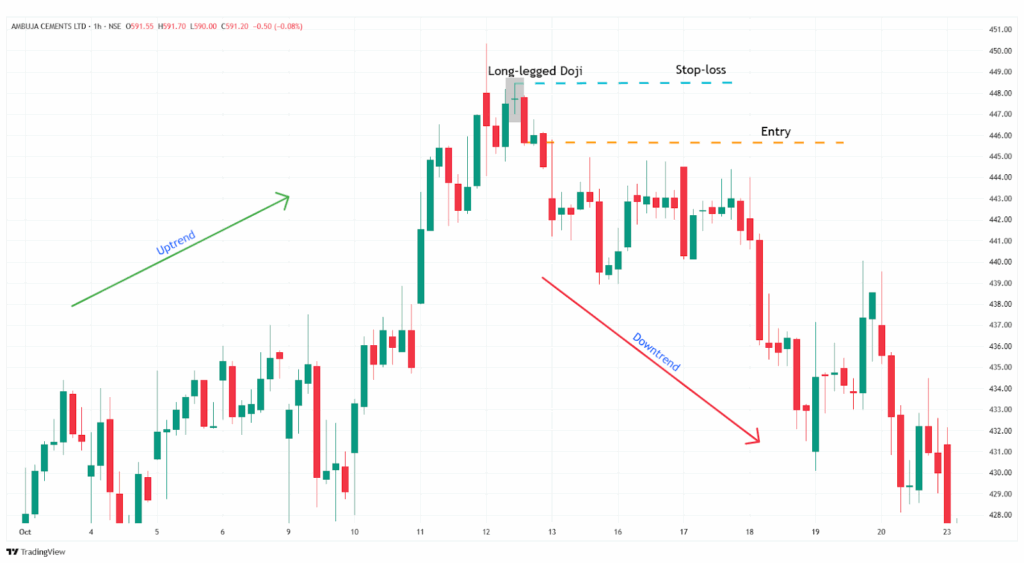
Example:
When you look at the image below, the chart of “Ambuja Cement Ltd” stock at a 1-hour timeframe on 12th October 2023. You can spot the Long Legged Doji candlestick followed by the confirmation with a bearish candlestick, indicating a downtrend ahead.
When to use the Long-Legged Doji candlestick?
- You can look for the long-legged doji candlestick i an uptrend and a downtrend to identify the potential reversals.
- After a Strong Price Move, it may signal that the trend is losing momentum, and a pullback or reversal could be near, giving you a clear indication of the trend.
- The candlestick pattern can also be used as a strong resistance or support level, according to the trend.
What are the limitations of the Long-legged Doji candlestick?
- The long-legged candlestick provides the trend direction, but does not provide the strength of the trend.
- In a volatile market, due to an excess in volume, false signals may be generated, making it hard to identify the potential upcoming trends.
- In a range-bound market, due to a lack of volume, it can often be spotted, making it hard to identify the potential upcoming trends.
- The direction of the trend is dependent on the next candlestick. There might be a delay in confirmation.
In Closing
In this article, we discussed the Long-legged Doji candlestick pattern, its structure, the psychology of the pattern, how to trade it, along with an example of the trade, when to use it, and its limitations.
The Long-legged Doji candlestick is a powerful Doji candlestick signalling the market sentiment, and it offers multiple opportunities for beginners with clear entry and exit signals. Making it an accessible pattern.
In the financial markets, no indicator or tool is 100% accurate. When the Long-legged Doji candlestick pattern is combined with additional indicators or tools, the efficiency and accuracy are high, and with proper risk management and discipline can pave the path to profitability.
