
In trading or investing, there are single candlestick patterns. Those are capable of identifying potential trend reversals. They are easy to identify and indicate an optimal entry and exit point during the price action. During the indecision in the market, the Doji candlestick is formed.
In this article, we will cover one of the Doji Candlestick Patterns, Neutral Doji, its structure, how to trade it with an example scenario, and the candlestick psychological pattern, along with its advantages and disadvantages.
What is the Neutral Doji?
The Neutral Doji Candlestick is a single-indecision reversal pattern, signaling uncertainty and a change in the market trend or continuation in the ongoing trend. The security’s opening and closing prices are virtually the same or show a little difference with a small upper and lower wick.
The Neutral Doji Candlestick is formed when the strength of buyers and sellers is balanced, indicating no clear trend control.
Structure of Neutral Doji
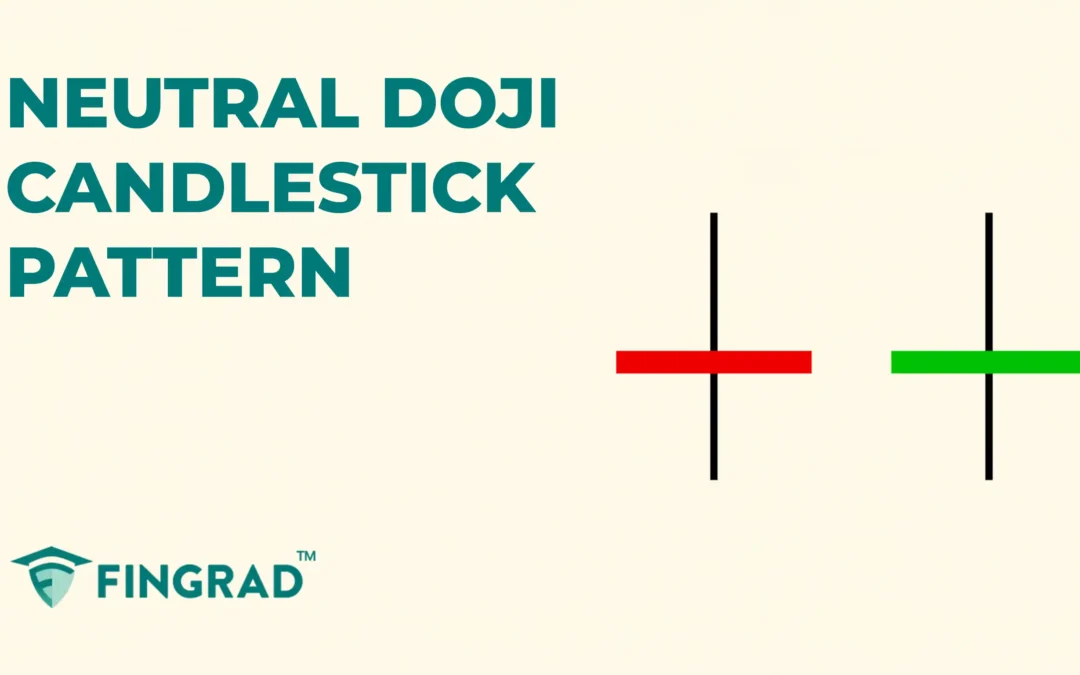
The Neutral Doji can be spotted at the top or bottom of the trend. The candlestick color can be red or green.
- A Neutral Doji candle has an extremely small or non-existent real body, indicating that the opening and closing prices for the period are nearly identical.
- The upper and lower shadow/wick formed are usually balanced out.

Psychology Behind the Neutral Top candlestick pattern
- In an uptrend, the buyers dominate and push the price up to its higher high, and then sellers step in to push the price down. At the same time, buyers also defend the price levels and create a balance of pressure, and the price closes very near its opening with identically the same upper and lower wicks.
- In a downtrend, the sellers dominate and push the price down to lower lows, and then buyers step in to push the price up. At the same time, sellers also defend the price levels and create a balance of pressure, and the price closes very near its opening with identically the same upper and lower wicks.
- Rejection of the high and low points: The upper and lower shadows are formed. This displays the attempt of both buyers and sellers to control the trend, but neither side took over.
- Indecision Closing: In the end, the price closes near its opening, indicating indecision in the market.
How to trade a Neutral Doji candlestick pattern?
The Neutral Doji candlestick is versatile across all frames. In the lower timeframe, it is often spotted, making it hard to trade.
The next candlestick after the Neutral Doji is a strong directional candle (bullish if anticipating an uptrend, bearish if a downtrend)
Buy Signal:
Entry:
- As the next candle closes above the high of the Neutral Doji candle, with a strong bullish candlestick, plan a trade for an upward direction.
Stop-loss:
- The stop-loss for the trade is the low of the Neutral Doji candlestick.
Target:
- An ideal target is the next resistance line, or, based on your risk-reward ratio of 1:1 or 1:2, as the primary target can vary.
Example:
When you look at the image below, the chart of “ADANI Enterprises Ltd” stock at a 1-hour timeframe on 26th July 2024. You can spot the Neutral Doji candlestick followed by the confirmation with a bullish candlestick, indicating an uptrend ahead.

Sell Signal:
Entry:
- As the next candle after the Neutral Doji candle closes below its low, with a strong bearish candlestick, plan a trade for a downward direction.
Stop-loss:
- The stop-loss for the trade is the high of the Neutral Doji candlestick
Target:
- An ideal target is the next support line, or based on your risk-reward ratio of 1:1 or 1:2.
Example:
When you look at the image below, the chart of “VEDANTA Ltd” stock at a 1-hour timeframe on 6th November 2024. You can spot the Neutral Doji candlestick followed by the confirmation with a bearish candlestick, indicating a downtrend ahead.

What are the Advantages of the Neutral Doji Candlestick?
- It is easy to identify and trade.
- The next candlestick after a Neutral Doji gives a clear understanding of the upcoming trend.
- It provides a non-biased signal, helping traders think clearly and wait for confirmation before making a move.
- The neutral doji pattern identified with the ongoing trend can also signal the continuation of the trend in the next trading sessions, which depends on the next candle’s close.
What are the disadvantages of the Neutral Doji Candlestick?
- Due to a lack of volume in a range-bound market, it is often spotted, making it hard to identify the potential upcoming trends.
- The direction of the trend is dependent on the next candlestick. You must wait till it confirms the trend direction.
- It provides the trend direction, but does not provide the strength of the trend.
In Closing
In this article, we discussed the Neutral Doji candlestick pattern, its structure, the psychology of the pattern, how to trade it, along with an example of the trade, and its advantages and disadvantages.
The Neutral Doji candlestick is a powerful single-candlestick pattern that leads and lags the price action according to the trading strategy, and it offers multiple opportunities for beginners with clear entry and exit signals. Making it an accessible pattern.
No indicator or tool in the financial markets all over the world is 100% accurate. When the Neutral Doji candlestick pattern is combined with additional indicators or tools, the efficiency and accuracy are high, and with proper risk management and discipline can pave the path to profitability.
