
When trading with technical analysis, candlesticks represent the behavior of the price action and help in identifying potential trends by displaying the strength between buyers and sellers. Among the candlestick patterns, the shooting star is one of the most reliable and simple to identify.
In this article, we will begin by explaining what the shooting star pattern is, its structure, and how to effectively trade it. We will also discuss candlestick psychology, an example of a trading scenario, and its advantages and disadvantages.
What is the Shooting Star Candlestick Pattern?
The shooting star is a bearish reversal pattern, signaling a downtrend. It is a commonly used single candlestick pattern.
When sellers step in strongly against the uptrend, a Shooting Star is formed at the top of the uptrend, indicating a potential downtrend in the next trading sessions, signaling traders to enter a short position in the security.
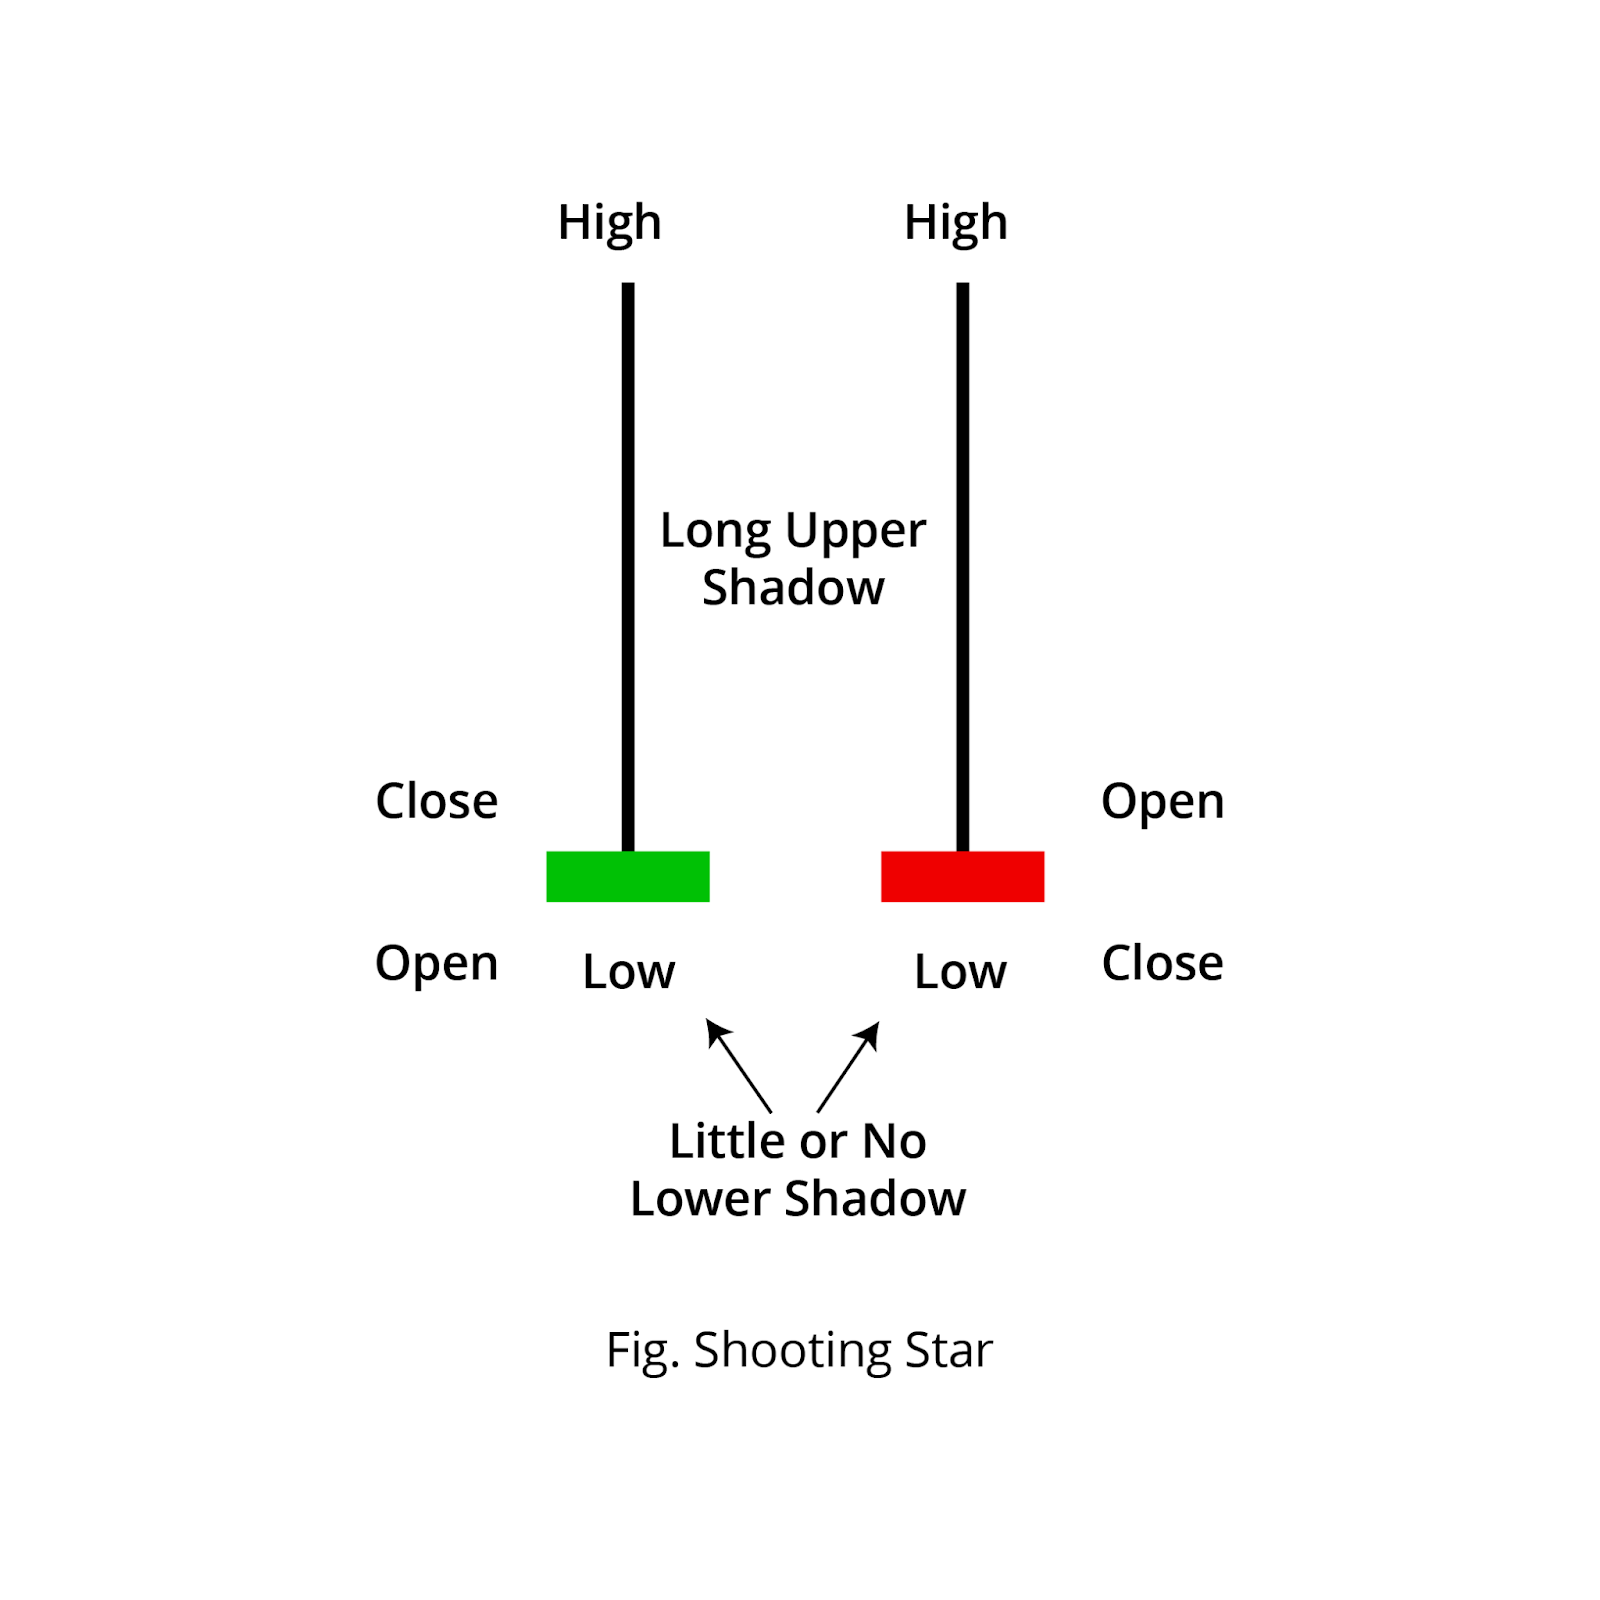
Structure:
- A Shooting Star has a small real body. The color of the body can be green or red.
- The pattern contains a long upper shadow/wick that is typically at least twice the length of the body.
- It has little to no lower shadow or wick.
Shooting star candlestick pattern psychology
- Buyers push up: In the uptrend, buyers are dominant, driving the price to its high.
- Sellers push down: At the peak, sellers see an opportunity and aggressively push the price down.
- Rejection of the high point: The long upper shadow displays that buyers tried to push the price up, but sellers strongly rejected this higher price and pushed it back down.
- Closing near open: The small closing body shows that the strength of sellers outweighs the buyer’s initial push, signaling a downtrend ahead.
How to trade a Shooting Star candlestick pattern?
The shooting star candlestick is versatile across all the frames. In the lower timeframe, it is often spotted, making it hard to find the potential reversals.
After spotting the Shooting Star candlestick at the top of the uptrend, plan for a short position entry as described below.
Entry
- If the next candle closes below the Shooting Star, that’s your signal to enter a short trade in the security.
Stop-loss
- An ideal stop-loss can be placed at the high of Shooting Star candlestick pattern formed.
Target
- The initial target can be the next support line formed after the pattern formation.
- Also, the target for the trade can be placed based on one’s risk-reward ratios.
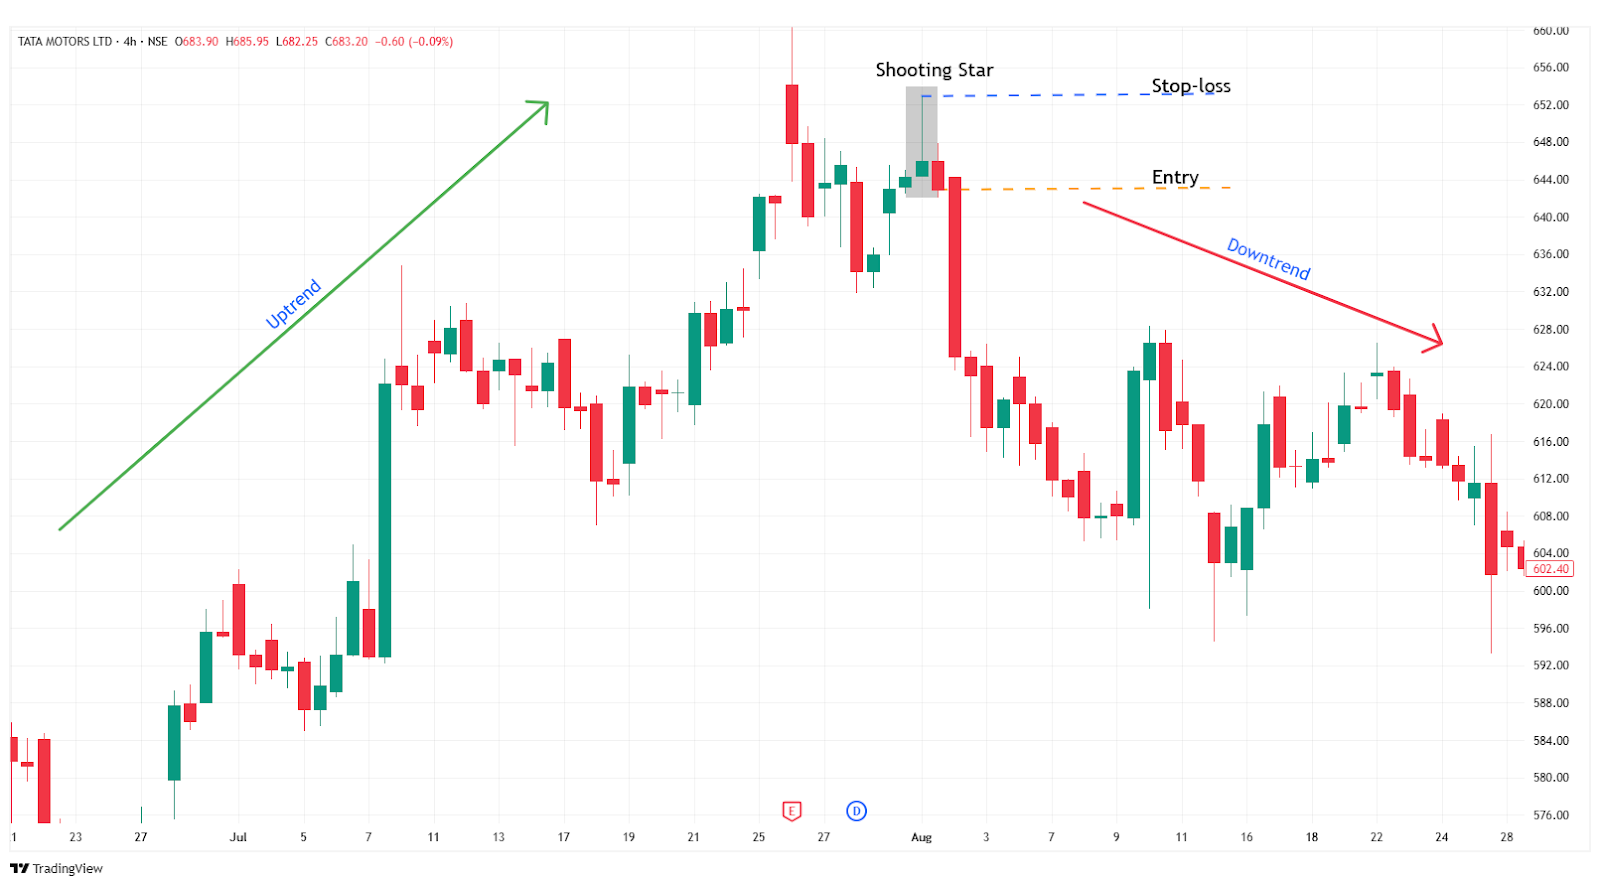
Example scenario
In the image below, you can look at the chart of “TATA Motors” stock at a 4-hour timeframe on 1st August 2023. You can see the sell signal generated using the Shooting Star candlestick pattern, as it is a trend reversal candlestick.
What are the advantages of the Shooting Star Candlestick?
- It is easy to identify and gives a clear picture of the upcoming downtrend after the pattern formation.
- With additional indicators and tools, the pattern is very accurate, and efficiency is high.
- If you have a long position in the trending market, a shooting star provides an early warning signal about trend reversals.
What are the disadvantages of the Shooting Star Candlestick?
- It often appears in price action, especially in low-volume conditions. Making it hard to identify the actual trend reversal, and resulting in a false signal.
- It is visually similar to an inverted Hammer candlestick pattern, which is a bullish signal, but the difference lies in the trend.
- Shooting Star tells you a reversal may be coming, but it doesn’t indicate the strength of the reversal.
In Closing
In the above article, we covered the Shooting Star Candlestick Pattern, how to trade, and their structure with an example, along with the candlestick psychological pattern, and lastly, their advantages and disadvantages.
Shooting Star Candlestick Pattern is a bearish trend reversal pattern that offers clear insights into price action. It helps traders to identify entry and exit signals, making it an accessible tool for trading.
In any financial market across the world, no indicator or tool is 100% accurate; when combined with additional indicators or tools, the efficiency and accuracy increase rapidly. By trading with a strong focus on proper risk management, discipline, and consistency, you can increase your chances of becoming profitable.
