
When your trades are based on technical analysis, you might come across indicators. One of the highly efficient and easy-to-trade indicators is the MACD indicator. It gives you a better understanding of the strength of the trend in the market and spot trading opportunities in the security.
In this article, we will understand what the MACD indicator is, how it is calculated, and we will understand two major strategies to trade using MACD with an example, and its limitations.
What is MACD?
MACD stands for Moving Average Convergence Divergence. It is a momentum-following indicator. It is mathematically calculated using two EMAs from the historical price data. The term Convergence means the movement towards each other, and divergence means movement away from each other.
When convergence occurs, it suggests momentum is slowing down. When divergence occurs, it suggests momentum is picking up.
There are three factors that the MACD depends on
MACD Line: The MACD Line is mathematically calculated by finding the difference between the EMA of 12 and 26 periods.
MACD Line = (EMA of 12-period) – (EMA of 26-period)
Signal Line: EMA of 9 periods and the MACD Line combine to generate a buy or sell signal based on the scenario.
Signal Line = 9-period EMA of the MACD Line
Histogram: It is a visual representation of the difference between the MACD Line and the Signal Line.
Histogram = MACD Line – Signal Line
- When the MACD Line is above the Signal Line, the Histogram bars are positive.
- When the MACD Line is below the Signal Line, the Histogram bars are negative.
How to Trade the MACD Indicator?
Select the MACD indicator, and a panel will appear below the main price chart displaying three lines MACD Line, the Zero Line, the Signal Line, and the Histogram (displayed in red and green to represent positive and negative values).
1. When the MACD crosses the Signal line:
Buy signal
Entry:
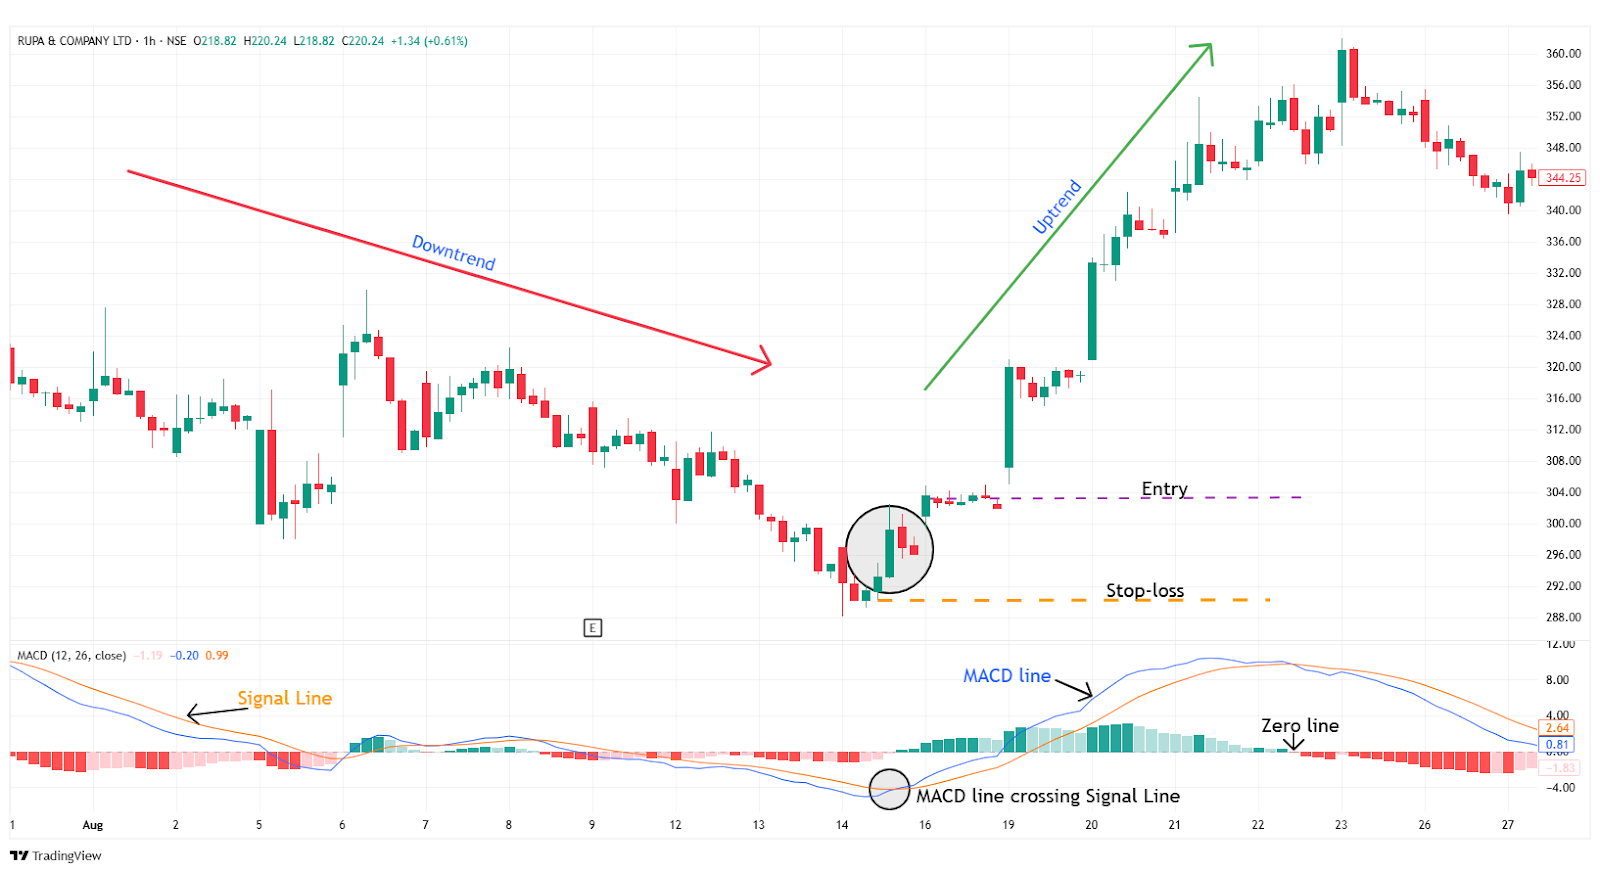
- If the MACD line crosses the Signal line upwards. It is a buy signal, and a long position can be placed.
Stop-loss:
- An ideal stop-loss is at the low of the previous candlestick crossing the line.
- Or below the most recent swing low that occurred before the MACD lines crossed.
Target:
- An ideal target is when the MACD line crosses below the Signal line.
- As per your risk-reward ratio(eg, 1:1, 1:2 or higher), you can set the targets according to the next further resistance levels.
Example: In the below chart example, you can look at the chart of “RUPA & Co Ltd” stock at a 1-hour timeframe on 14th August 2024, you can see the buy signal generated using the MACD Indicator.
Sell signal
Entry:
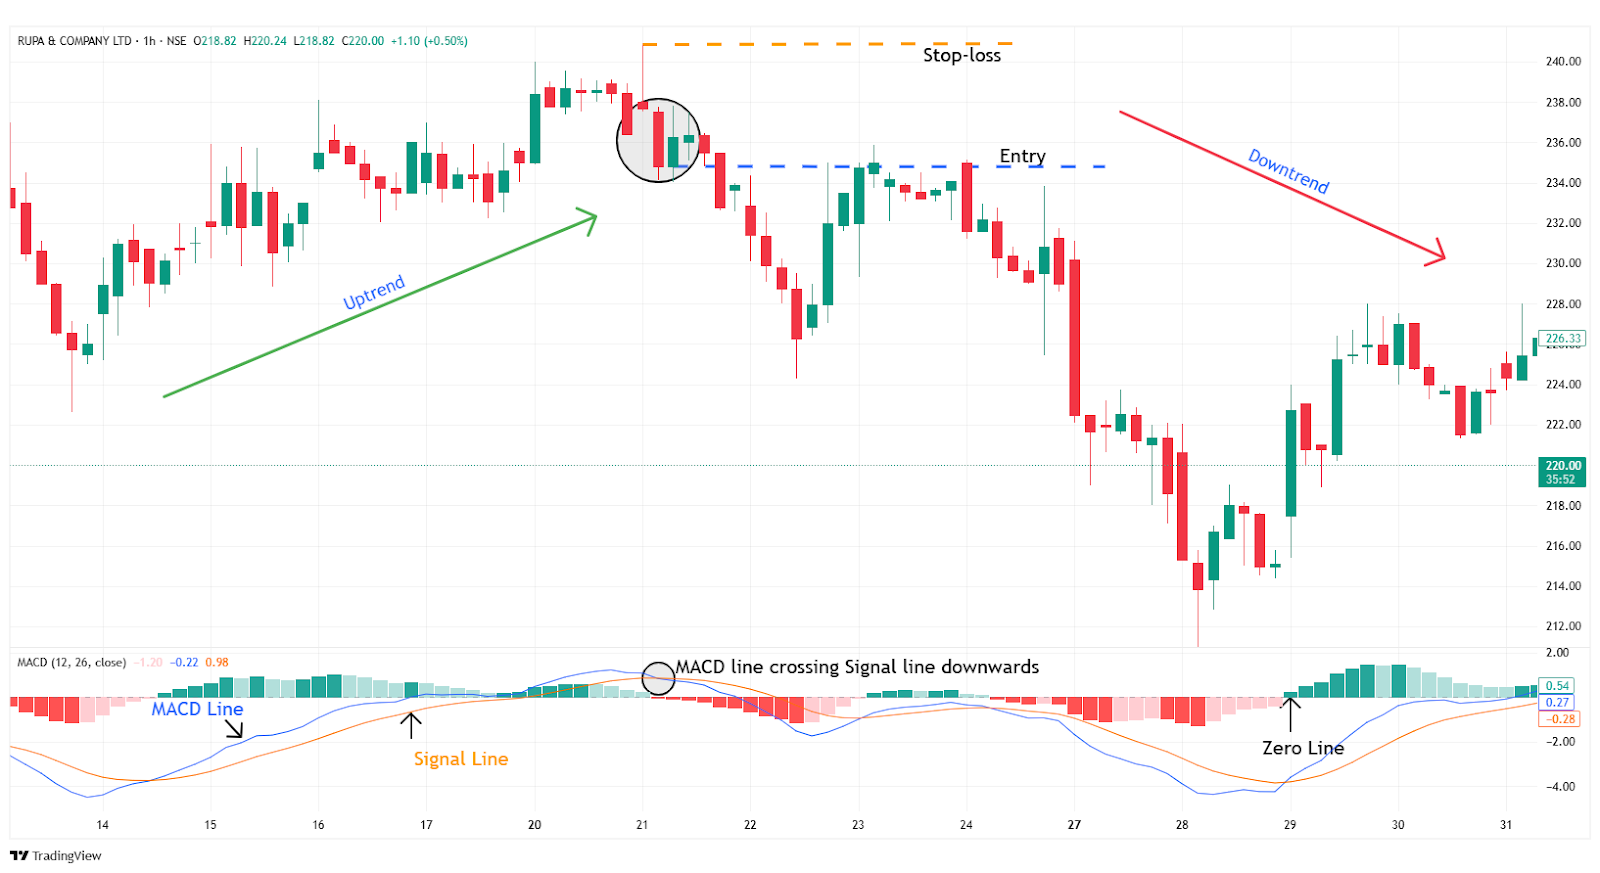
- As the MACD line crosses the signal line downwards, it is a sell signal, and a short position can be placed.
Stop-loss:
- An ideal stop-loss is at the high of the previous candlestick, crossing the line.
- Or above the most recent swing high that occurred before the MACD lines crossed.
Target:
- An ideal target is when the MACD line crosses above the Signal line.
- As per your risk-reward ratio(eg, 1:1, 1:2 or higher), you can set the targets according to the next further support levels.
Example: In the image below, you can look at the chart of “RUPA & Co Ltd” stock at a 1-hour timeframe on 21st January 2025. You can see the sell signal generated using the MACD Indicator as the MACD line crosses the Signal line downwards.
2. Zero Line Crossing Strategy
Buy signal
Entry:
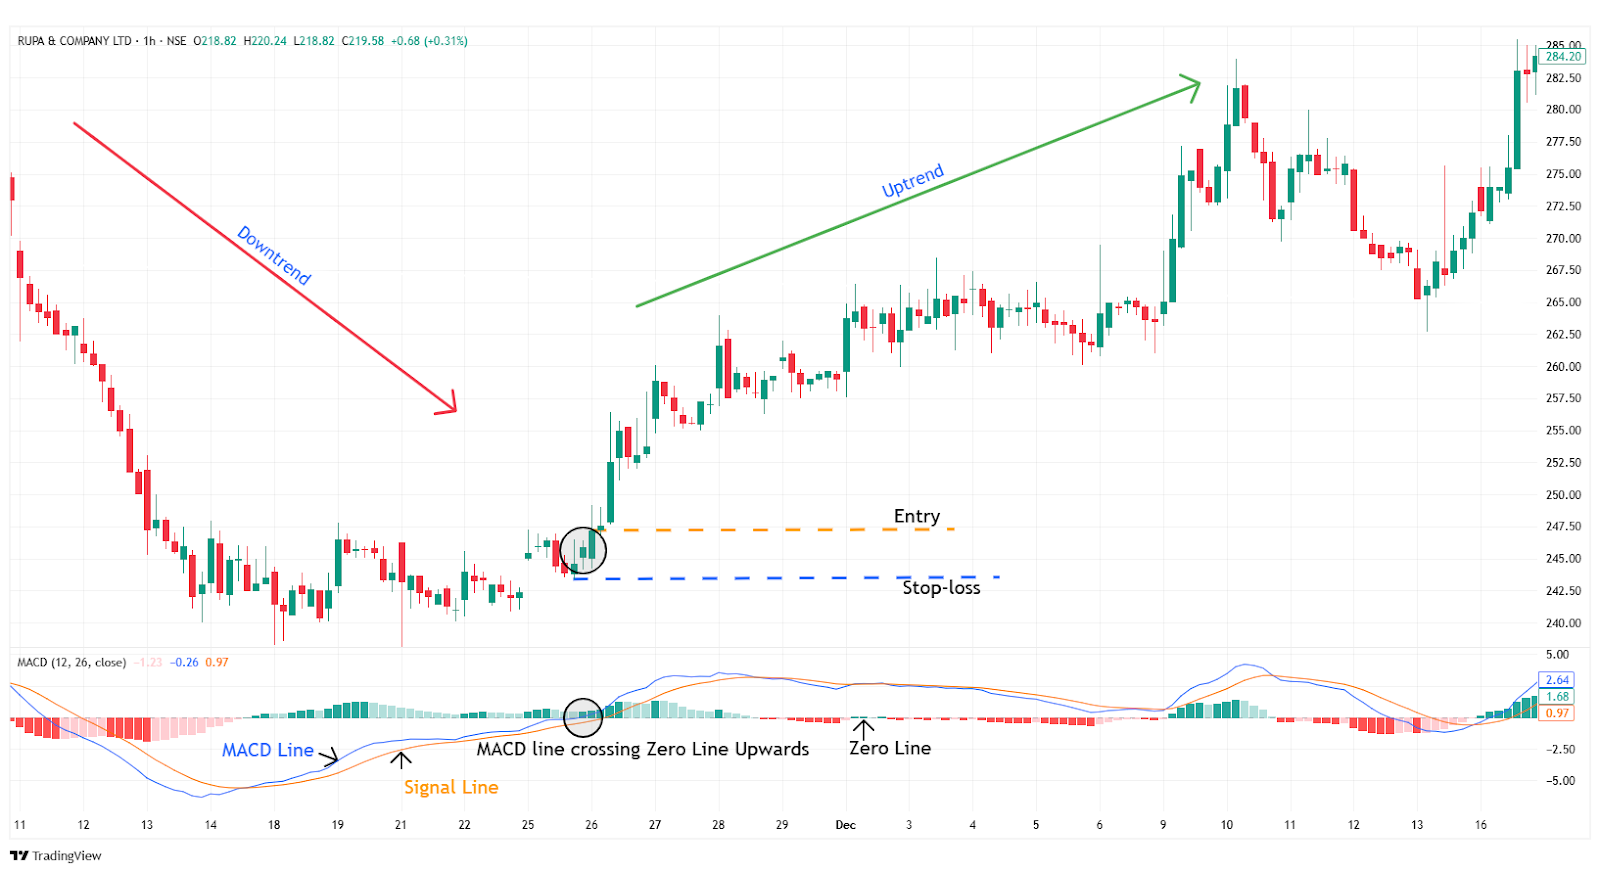
- As the MACD line crosses the Zero Line upwards. It is a buy signal, and a long position can be placed.
Stop-loss:
- An ideal stop-loss is at the low of the candlestick, where the MACD line crosses the Zero Line.
- Or you can also consider the low of the most recent swing low before the crossover.
Target:
- An ideal target can be considered when the MACD Line crosses below the Signal Line.
- As per your risk-reward ratio(eg, 1:1, 1:2 or higher), you can set the targets according to the next further resistance levels.
Example: In the below chart example, you can look at the chart of “RUPA & Co Ltd” stock at a 1-hour timeframe on 25th November 2024. You can see the buy signal generated using the MACD Indicator as it crosses the Zero line in an upward direction.
Sell signal
Entry:
- As the MACD line crosses the Zero Line downwards. It is a sell signal, and a short position can be placed.
Stop-loss:
- An ideal stop-loss is at the high of the candlestick, where the MACD line crosses the Zero Line.
- Or you can also consider the high above the most recent swing high before the crossover.
Target:
- An ideal target can be considered when the MACD Line crosses above the Signal Line.
- As per your risk-reward ratio(eg, 1:1, 1:2 or higher), you can set the targets according to the next further support levels.
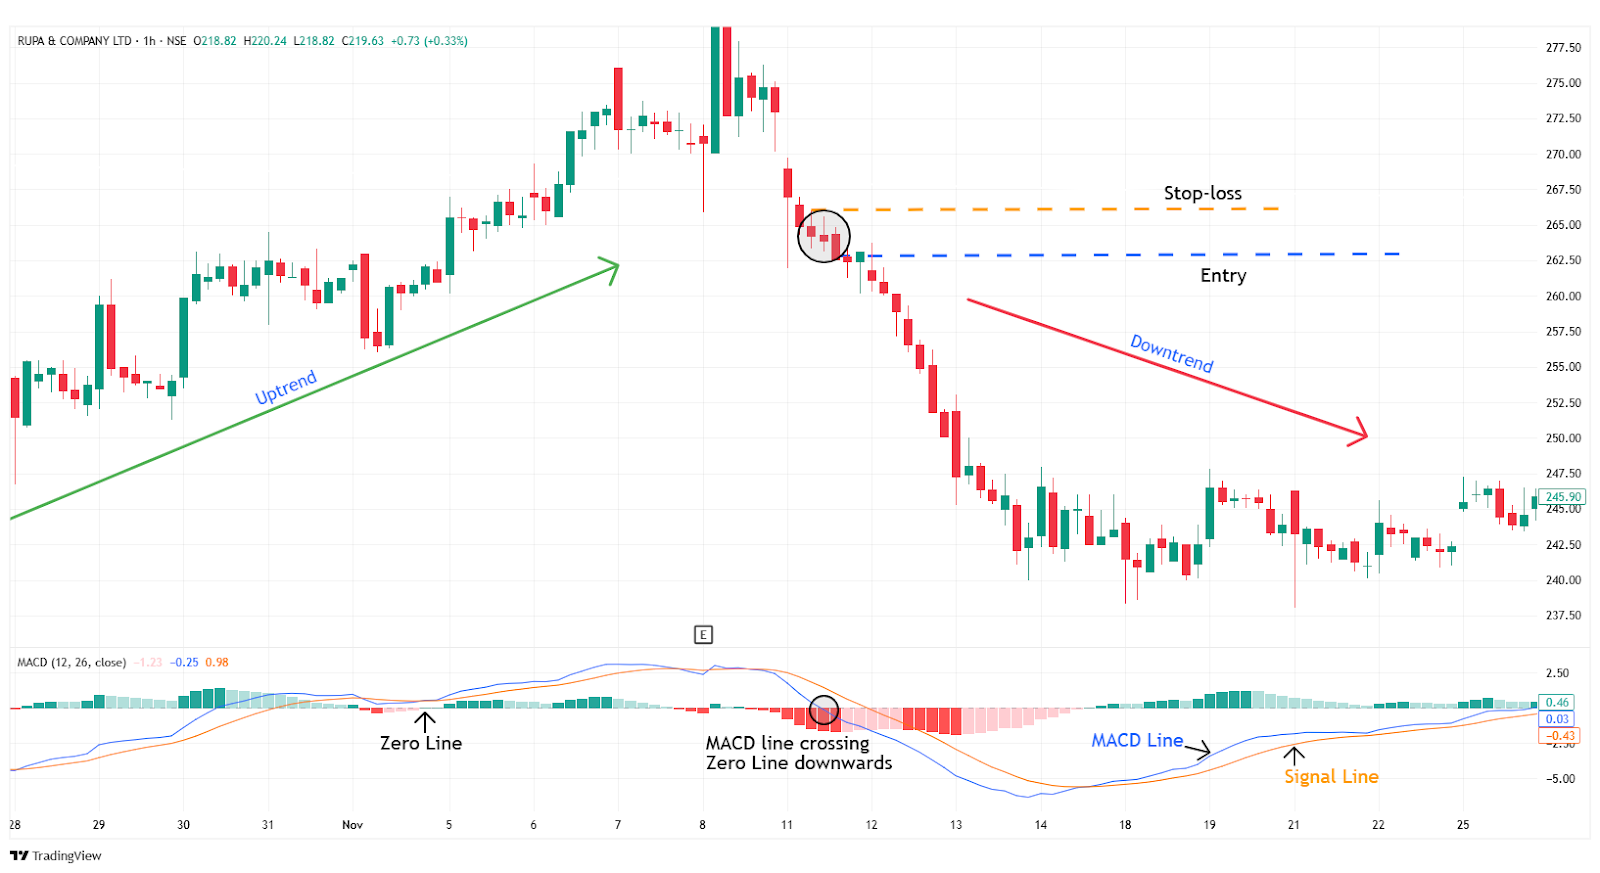
Example: In the image below, you can look at the chart of “RUPA & Co Ltd” stock at a 1-hour timeframe on 11th November 2024. You can see the sell signal generated using the MACD Indicator as it crosses the Zero line downwards.
What are the Limitations of MACD?
- Lagging Indicator: It follows the trend, making it dependent on the histogram data. Due to its nature, it reacts slowly to sudden changes in the market.
- In a sideways market due to a lack of volume after the signal, there is a lack of movement, resulting in a false trade.
- MACD is not reliably used to identify overbought or oversold price conditions, as it does not have a fixed scale for the price compared to RSI.
In Closing
In the article above, we have covered what MACD is, along with how they are calculated, different types of strategies to trade with an example, and its limitations.
MACD follows the price action of the security to calculate the moving average using multiple EMA lines, making it more efficient and accurate, and provides multiple setups to trade with clear entry and exit points, making it an accessible indicator for beginners.
In any financial market across the world, no indicator or tool is 100% accurate. When combined with additional indicators or tools, the efficiency and accuracy increase rapidly with proper risk management, and discipline can pave the path to profitability.
