
In trading, chart patterns are a key part of technical analysis, offering insights into how prices move and how trends may shift. These formations mirror the emotions of buyers and sellers in the market, providing traders with signals to anticipate upcoming price action. One such widely recognised formation is the Inverse Head and Shoulders pattern, which is considered a strong indicator of a potential bullish reversal.
In this article, we will discuss the inverse Head and Shoulders Pattern, its structure, how to identify it, how to trade it with an example, its advantages, and its disadvantages.
What is the Inverse Head and Shoulders Pattern?
The Inverse Head and Shoulders Pattern is a technical pattern that indicates the potential bullish reversal in an ongoing downtrend and signals a change in the market momentum as the pattern can be formed over days, weeks, or even months, depending on price action.
Structure:
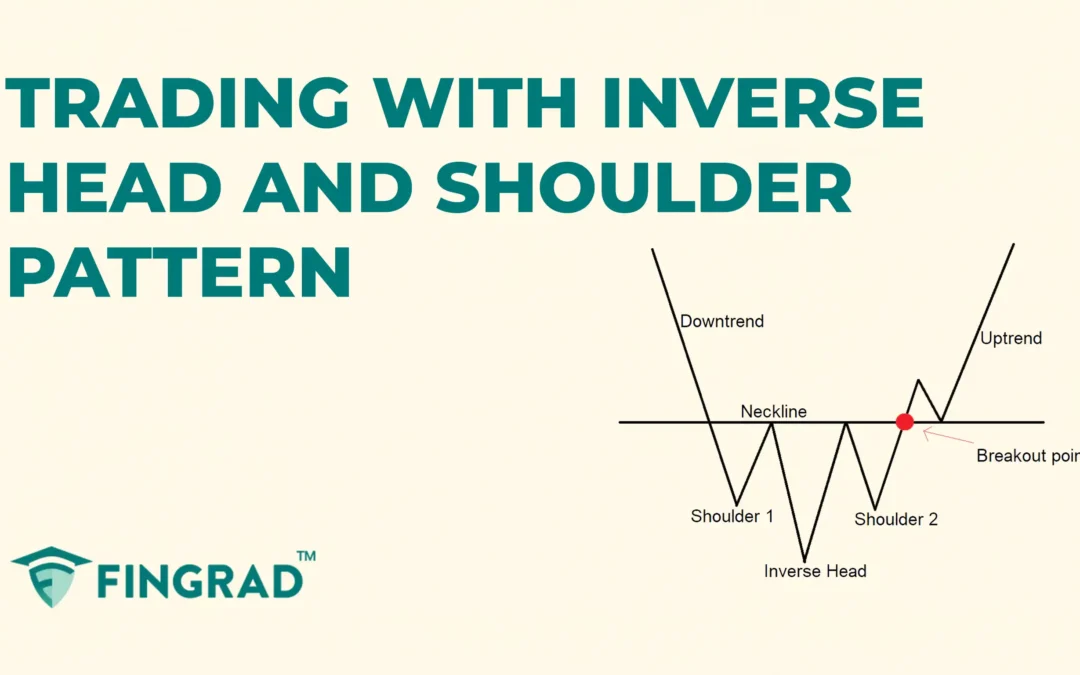
The Inverse Head and Shoulders Pattern is made up of three bottoms and a neckline.
- Left Shoulder: A low is formed during a downtrend, followed by a short correction of the price.
- Head: A deeper low is formed, followed by a price correction.
- Right Shoulder: A higher low is formed, followed by a temporary bounce of the price.
- Neckline: The resistance line drawn by connecting the high points between the left inverse shoulder, head, and right inverse shoulder, often horizontal or slightly sloped.

How to identify the Inverse Head and Shoulders Pattern?
Spot the security trading in a downtrend, look for the three distinct bottoms at any timeframe, and make sure the second bottom (head) is deeper than both the shoulders. Then, draw the neckline by connecting the high points between the shoulders and the head, which often act as key resistance levels.
Wait for a breakout candlestick: A confirmed break above the neckline is your signal to trade the security in an upward direction.
Calculate the target: Measure the vertical distance from the inverse head to the neckline and project this distance upward from the neckline breakout point.
How to trade the Inverse Head and Shoulders Pattern?
Entry:
- Enter a long position in the security when the price breaks and closes above the neckline resistance level.
Stop-loss:
- Place a stop-loss just below the right inverse shoulder.
Target:
- Set the primary target based on the measured distance from the inverse head to the neckline and projecting it upward from the breakout point.
- If you spot any candlestick or pattern signalling a bearish reversal, then book partial profit or trail your stop-loss.
Example:
In the image below, you can refer to the chart of the “ NIFTY 50” index at a 1-day timeframe from 22nd February to 27th April 2023, and you can see the buy signal generated by the Inverse Head and Shoulders pattern.

What are the advantages of the Inverse Head and Shoulders Pattern?
- The Inverse Head and Shoulders pattern provides a strong and reliable bullish reversal pattern.
- The Inverse Head and Shoulders pattern provides a clear entry, exit, and target to trade for everyone.
- The Inverse Head and Shoulders pattern is versatile across all timeframes and all other security markets, as a single strategy can be applicable for all markets.
What are the disadvantages of the Inverse Head and Shoulders pattern?
- By the time the reversal is confirmed, much of the move may have already happened.
- The Inverse Head and Shoulders pattern is hard to identify, especially in volatile markets or uncertain price action.
- In the Inverse Head and Shoulders pattern, the price may break the neckline, but there is a bearish reversal quickly, leading to a false breakout and a continuation of a bearish trend.
In Closing
In this article, we covered the Inverse Head and Shoulders pattern, its structure, how to identify the pattern, how to trade it, along with an example, its advantages, and disadvantages.
The Inverse Head and Shoulders pattern is a powerful tool that signals potential bullish reversals in the ongoing downtrend, and it indicates multiple opportunities for clear entry and exit signals.
Your profitability depends on your approach to the trade, your risk management, and your mindset when you are holding the trade, as no indicator or tool is 100% accurate, and when the Inverse Head and Shoulders pattern is combined with additional indicators or tools (RSI, MACD, or others), its efficiency and accuracy increase rapidly.
