
In trading, technical analysis plays a vital role in understanding market behaviour by studying price charts and recurring patterns. These patterns reflect market psychology and help traders anticipate potential future movements. Among the many chart formations, the Head and Shoulders pattern stands out as one of the most reliable signals of a possible trend reversal.
In this article, we’ll break down the Head and Shoulders pattern, its structure, how to identify it, ways to trade it effectively with an example, along with its key advantages and disadvantages.
What is the Head and Shoulders Pattern?
The Head and Shoulders Pattern is a technical pattern that indicates the potential reversal of an ongoing trend and signals a change in market momentum. The pattern can form over days, weeks, or even months, depending on the price action.
There are two types of the Head and Shoulders Pattern:
- Standard Head and Shoulders Pattern: It is a bearish trend reversal pattern spotted at the top of the price chart.
- Inverse Head and Shoulders Pattern: It is a bullish trend reversal pattern spotted at the bottom of the price chart.
In this article, we will be discussing the standard Head and Shoulders pattern.
Structure
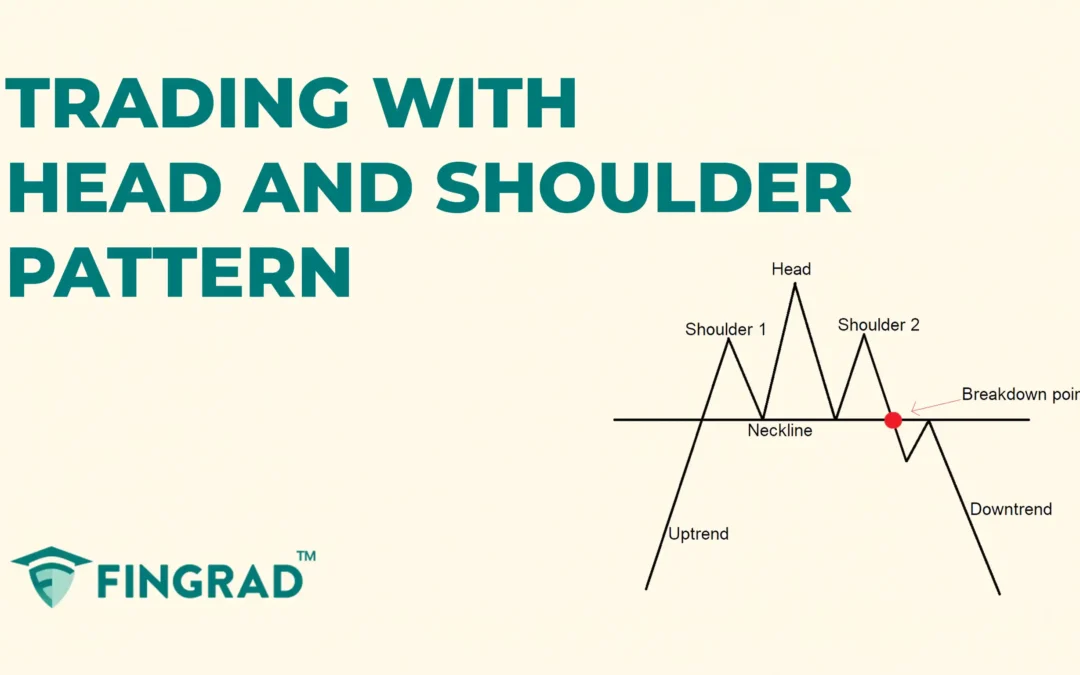
The Head and Shoulders Pattern is made up of three peaks and a neckline.
- Left Shoulder: A peak forms during an uptrend, followed by a short correction of the price.
- Head: A higher peak is formed, followed by a short correction of the price.
- Right Shoulder: A lower peak is formed, followed by a short correction of the price.
- Neckline: The support line drawn by connecting the low points between the left shoulder, head, and right shoulder, often horizontal or slightly sloped.

How to identify the Head and Shoulders Pattern?
Spot the security trading in an uptrend, look for the three distinct peaks at any timeframe, and make sure the second peak (head) is higher than both the shoulders, then draw the neckline by connecting the low points between the shoulders and the head, which often act as key support levels.
Wait for a breakout candlestick: A confirmed break below the neckline is your signal to trade the security in a downward direction.
Calculate the target: Measure the vertical distance from the head to the neckline and project this distance downward from the neckline breakout point.
How to trade the Head and Shoulders Pattern?
Entry:
- Typically, entry to the short position is taken immediately on close below the neckline or next candle below the neckline
Stop-loss:
- Place a stop-loss just above the right shoulder.
Target:
- Set your primary target based on the measured projection from the head to the neckline.
- If you spot any candlestick or pattern signalling a bullish reversal, then book partial profit or trail your stop-loss.
Example:
In the image below, you refer to the chart of the “ NIFTY 50” index at a 4-hour timeframe from 22nd September to 22nd October 2021, and you can see the sell signal generated by the Head and Shoulders pattern.

What are the advantages of the Head and Shoulders pattern?
- The Head and Shoulders pattern is one of the highly reliable bearish reversal patterns in technical analysis.
- The Head and Shoulders pattern provides a clear entry, exit, and target to trade for everyone.
- The Head and Shoulders pattern is versatile across all timeframes and all other security markets, as a single strategy can be applicable for all markets.
What are the disadvantages of the Head and Shoulders pattern?
- The Head and Shoulders pattern is hard to identify, especially during the messy charts.
- In the Head and Shoulders pattern price may break the neckline but reverse quickly, leading to a false breakout.
- By the time the Head and Shoulders pattern confirms, much of the move may have already happened.
In Closing
In this article, we covered the Head and Shoulders pattern, its structure, how to identify the pattern, how to trade it, along with an example, its advantages, and disadvantages.
The Head and Shoulders pattern is a powerful tool that signals reversals in the ongoing trend, and it indicates multiple opportunities for clear entry and exit signals.
Your profitability depends on your approach to the trade, your risk management, and your mindset when you are holding the trade, as no indicator or tool is 100% accurate, and when the Head and Shoulders pattern is combined with additional indicators or tools (RSI, MACD, or others), its efficiency and accuracy increase rapidly.
