
In security, when buyers and sellers are balanced, an indecision candlestick is formed, displaying the sentiment of the trading price action. For beginners, trading after the indecision candlestick is formed is difficult due to a lack of understanding of the pattern. In the article below, we will discuss one of the candlesticks and its trading strategies.
In this article, we will cover the High Wave Candlestick Pattern, its structure, psychological pattern, how to trade it with an example scenario using the candlestick to signal, its advantages, and its disadvantages.
What is the High Wave Candlestick pattern?
The High Wave Candlestick pattern is a single-indecision reversal pattern, signalling uncertainty and a change in the market trend, but it can also appear during continuations, which depends on the confirmation from the next candle formation. The security’s opening and closing prices are virtually the same or show a little difference with a long upper and lower wick.
The High Wave Candlestick pattern is formed when the strength of buyers and sellers is balanced, indicating uncertainty in an ongoing trend.
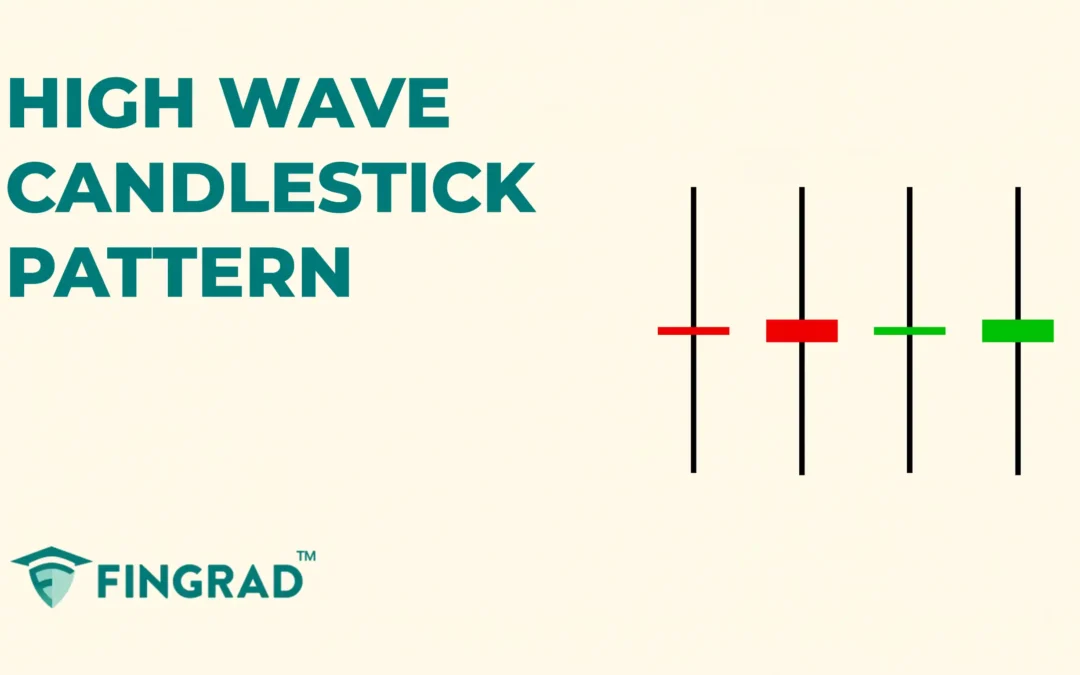
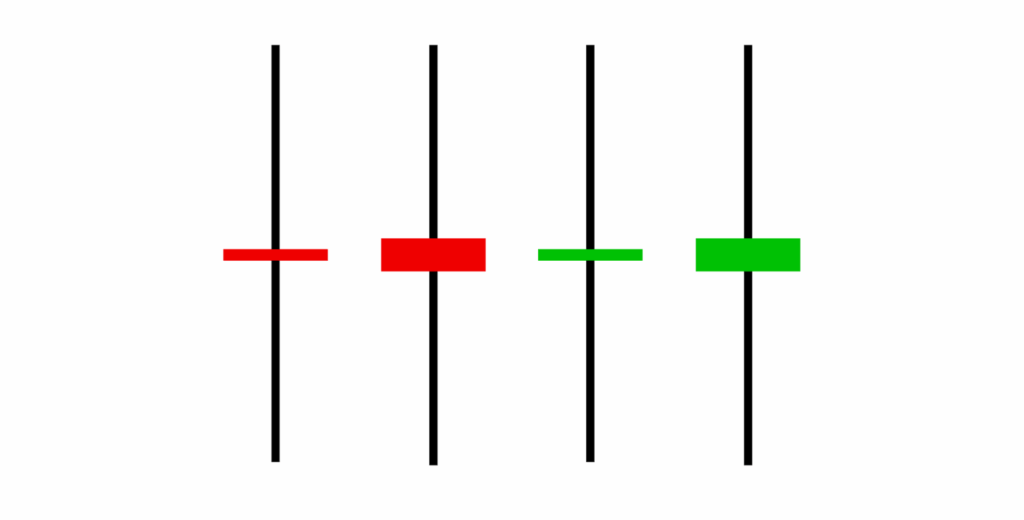
Structure:
The High Wave candlestick pattern can be spotted at the top or bottom of the trend. The candlestick colour can be red or green.
- A High Wave candlestick has a small body, indicating that the opening and closing prices have a very small difference.
- The upper and lower shadow/wick is at least twice the length of the body, displaying the volatility in the security.
The High Wave candlestick psychological pattern:
- In an uptrend, the buyers dominate and push the price up to its higher high. At the top, sellers step in and start to push the price down. At the same time, buyers defend the price levels and create a balance of pressure, forming a long upper and lower wick with a small body of the candlestick in the middle.
- In a downtrend, the sellers dominate and push the price down to its lower low. At the bottom, buyers step in and start to push the price up. At the same time, sellers defend the price levels and create a balance of pressure, forming a long upper and lower wick with a small body of the candlestick in the middle.
- Rejection of both the high and low points: The long upper and lower wicks display the attempt of both buyers and sellers to control the trend, but neither side took over.
- Indecision Candlestick Closing: In the end, the price closes near its opening, indicating indecision in the market.
How to trade the High Wave candlestick pattern?
The High Wave candlestick is versatile across all the frames. In the lower timeframe, it is often spotted, making it hard to trade.
The next candlestick after the High Wave is a strong directional candlestick (bullish if anticipating an uptrend, bearish if a downtrend).
Buy Signal:
Entry:
- As the next candlestick closes above the high of the High Wave candlestick, a long position entry can be placed in the security.
Stop-loss:
- The stop-loss for the trade is placed at the low of the High Wave candlestick.
Target:
- The primary target is the next resistance line, as per your risk-reward ratio of 1:1 or 1:2, as the primary target can vary.
- In further price action, if you spot the reversal candlestick, then book partial profit or trail the stop-loss.
Example:
When you look at the image below, the chart of “WIPRO Ltd” stock at a 1-hour timeframe on 11th October 2024. You can spot the High Wave candlestick followed by the confirmation with a bullish candlestick, indicating an uptrend ahead.

Sell Signal:
Entry:
- As the next candle after the High Wave candlestick closes below its low, a short position entry can be placed in the security.
Stop-loss:
- The stop-loss for the trade is the high of the High Wave candlestick
Target:
- An ideal target is the next support line, as per your risk-reward ratio of 1:1 or 1:2. The primary target can vary.
- In further price action, if you spot the reversal candlestick, then book partial profit or trail the stop-loss.
Example:
When you look at the image below, the chart of “RIL Ltd” stock at a 1-hour timeframe on 5th February 2025. You can spot the High Wave candlestick followed by the confirmation with a bearish candlestick, indicating a downtrend ahead.

The advantages of the High Wave Candlestick:
- It provides an early indication of uncertainty and volatility in the price action.
- It is versatile across all timeframes and other security markets, as a single strategy is applicable across all markets.
- The next candlestick after a High Wave candlestick gives a clear understanding of the upcoming trend.
- The candlestick is flexible across all trends, asd it can be spotted in an uptrend, downtrend, or a sideways market.
What are the disadvantages of the High Wave Candlestick?
- The direction of the trend is dependent on the next candlestick. You must wait till it confirms the trend direction.
- In high volatility markets, the high wave candlestick pattern can often appear, making it hard to identify the optimal entry and exit points.
- As the pattern is often spotted, it might lead to overtrading for beginners.
In Closing
In this article, we explored the High Wave candlestick pattern, its structure, the psychology of the pattern, how to trade it, along with an example of the trade, its advantages, and its disadvantages.
The High Wave candlestick is a powerful single-candlestick signalling uncertainty in the security and the pattern that leads and lags the price action according to the trading strategy, and it offers multiple opportunities for beginners with clear entry and exit signals. Making it an accessible pattern.
No indicator or tool in the financial markets all over the world is 100% accurate, and when the High Wave candlestick pattern is combined with additional indicators or tools like RSI, MACD, or others, the efficiency and accuracy are high, and with proper risk management and discipline, can pave the path to profitability.
