In Technical analysis, there are candlestick patterns that are rare to spot, and when spotted, they give a strong directional movement according to...

In Technical analysis, there are candlestick patterns that are rare to spot, and when spotted, they give a strong directional movement according to...
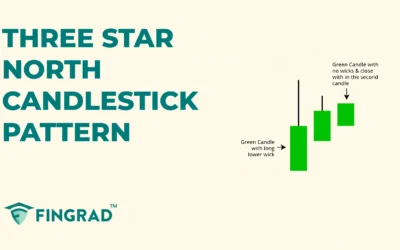
In Technical analysis, some candlestick patterns are rare to spot, and when spotted, they give a strong directional movement according to the type...
Technical analysis involves tools and indicators that provide you with a better understanding of the price action to develop your trading...
In all financial markets, candlesticks display the sentiment of the price action and the strength of buyers and sellers. When the strength between...
In technical analysis, candlestick patterns are one of the most effective tools for understanding market psychology and predicting potential price...
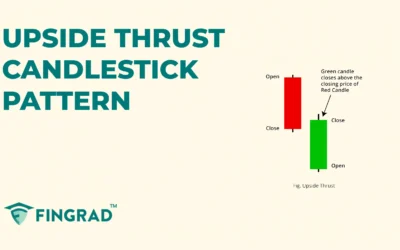
In trading or investing, identifying highly efficient, accurate, and low-risk candlestick patterns is hard, not impossible. The Upside Thrust is one...
In trading, candlestick patterns are one of the most widely used tools to analyze market sentiment and predict potential price reversals. They...
In trading, technical analysis is one of the most effective ways to understand market behaviour by studying price movements and chart patterns....
In Technical analysis, there are candlestick patterns that are rare to spot, and when they are spotted, they indicate a strong directional movement...
For new traders looking to understand trend shifts, learning chart patterns can help highlight potential reversals and continuations, though they...
Across all the financial markets in the world, technical analysis gives an understanding of the price action and the strength of the buyers and...
For new traders seeking to understand trend dynamics, learning chart patterns can help highlight potential reversals and continuations, though they...
In technical analysis, traders use a variety of tools and patterns to analyse price movement and have a huge impact on the price, provide a clear...
When your trading is based on technical analysis, you are likely to come across tools and indicators. These tools include chart patterns, which...
When you begin trading, it is common to experience a form of overtrading, either to make profits, recover losses, or find the optimal entry and exit...
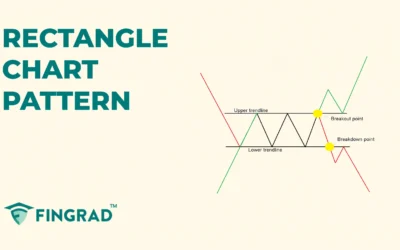
In financial markets worldwide, chart patterns help traders analyse the price action, trend, and volatility of markets to identify trend reversals...
In Technical analysis, there are chart patterns that are rare to spot, and when spotted, they give a strong directional movement according to the...
When trading with technical analysis, learning chart patterns can help interpret price action and structure trades more efficiently, though they...
When you begin trading, you would want to avoid unnecessary risky trades. Then, learning chart patterns can help interpret price action and...
Technical analysis involves trading with tools and indicators, which are powerful and reliable during your trades. One such pattern is the...
When you begin trading, you would want to avoid unnecessary risky trades. Then, learning chart patterns can help interpret price action and...
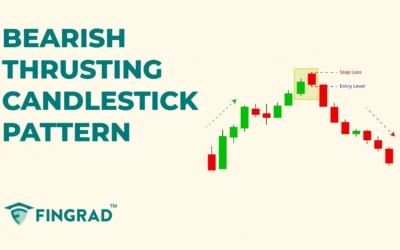
In trading, chart patterns play an important role in understanding market psychology and forecasting price movements. These patterns often highlight...
In trading, technical analysis plays a crucial role in helping traders understand price behaviour and predict future market trends. By studying...
New traders often struggle to spot and enter high-probability trades due to various scenarios, a lack of confidence in the trade, a lack of risk...
If your trading is based on technical analysis, then you are likely to come across powerful indicators and tools, like chart patterns and many...
In technical analysis, chart patterns are a visual representation of price action, displaying the strength of buyers and sellers in the market or...
When trading price action-based using technical analysis, you may have encountered a chart pattern during the price action's consolidation phase....
When your trading is based on technical analysis, then you might come across the chart pattern as they are visual representations of price movements...
When you begin trading, you would want to avoid unnecessary risk and trade efficiently. Therefore, one must start learning the chart patterns, as...
In trading, technical analysis is widely used to study price movements and identify patterns that reveal market behaviour. These patterns help...

When you begin trading, you would want to avoid unnecessary risky trades. That’s when learning chart patterns becomes essential, as they are easy to...
In trading, tools are widely used in technical analysis to study price movements and predict future market behaviour. These patterns reflect the...
If you are a trader or an inventor using technical analysis for your trades, then you must learn about the powerful chart pattern that helps traders...
When you begin trading, you will want to identify the potential reversal and continuation of an ongoing trend. Then, you must learn about the...

If your trading is based on technical analysis using tools and indicators, then it is important to understand the powerful chart pattern, as it...
In trading, technical analysis helps traders study price charts and patterns to anticipate future market movements. Chart patterns, in particular,...
If you rely on technical analysis, you’ve likely come across powerful indicators and tools during your trade, such as candlestick patterns, which...
In technical analysis, chart patterns play a crucial role in helping traders identify shifts in market trends and make informed trading decisions....
If your trading is based on technical analysis, you've likely encountered powerful candlestick patterns that help identify potential trend...
For traders seeking easily identifiable and impactful trend reversal signals. Then you must learn about the chart patterns, as they have a huge...
In technical analysis, chart patterns are essential tools that help traders understand price behaviour and predict future market movements. These...
In trading, chart patterns are a key part of technical analysis, offering insights into how prices move and how trends may shift. These formations...
In trading, technical analysis plays a vital role in understanding market behaviour by studying price charts and recurring patterns. These patterns...

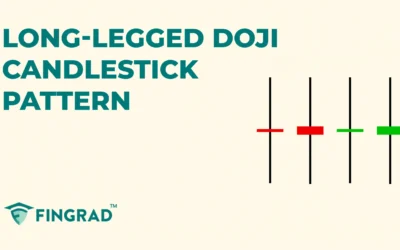
When you are trading price action-based using technical analysis, you might have seen the candlesticks with a small body and long upper and lower...
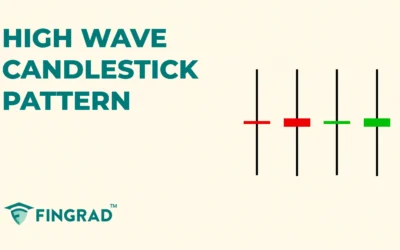
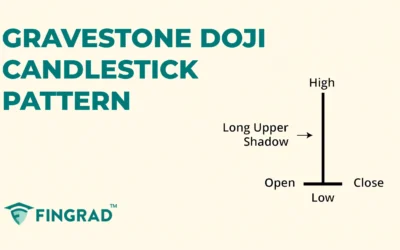
In security, when buyers and sellers are balanced, an indecision candlestick is formed, displaying the sentiment of the trading price action. For...
In trading, the candlestick pattern offers a clearer understanding of price action, displaying the strength of buyers and sellers. There are...
When you start trading it's hard to control your emotions on overtrading, then you must start to trade using the candlestick pattern which are rare...
In Technical analysis, some candlestick patterns are rare to spot, but when spotted, they give a strong directional movement according to the nature...
When you begin trading or investing, you may not be able to identify or enter the potential trades due to various scenarios, a lack of confidence in...
In the world of technical analysis, candlestick patterns offer valuable insights into the price action and the sentiment of the buyers and sellers....

This will close in 0 seconds